Money screens are read differently from other screens. People compare amounts down a column, check that totals match, and look for the sign before the number. Small type and colour decisions decide whether they trust what they see.
These are the ten rules I check on every finance screen in Viola UI. Each one has an example from the kit’s own portfolio, and the full checklist is at the end to copy.
The 10 rules
1. Use tabular figures for every number
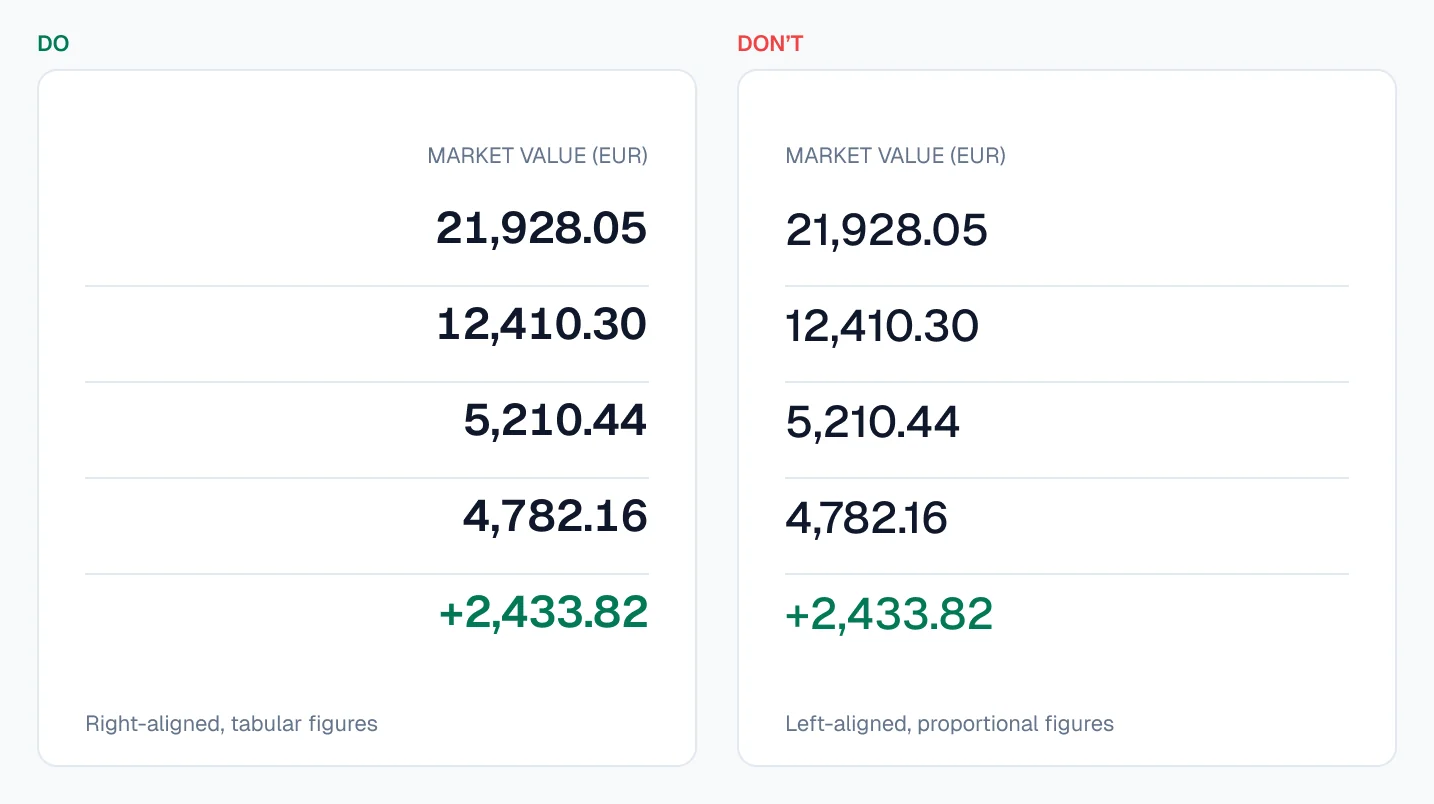
In tabular figures every digit has the same width, so amounts line up in a column and don’t shift when they update. Proportional figures look nicer in a sentence and break every table. In Figma it’s a setting in the text’s type details; in CSS it’s font-variant-numeric: tabular-nums.
Do: set it on every money text style, not on individual layers.
2. Right-align numbers, left-align text
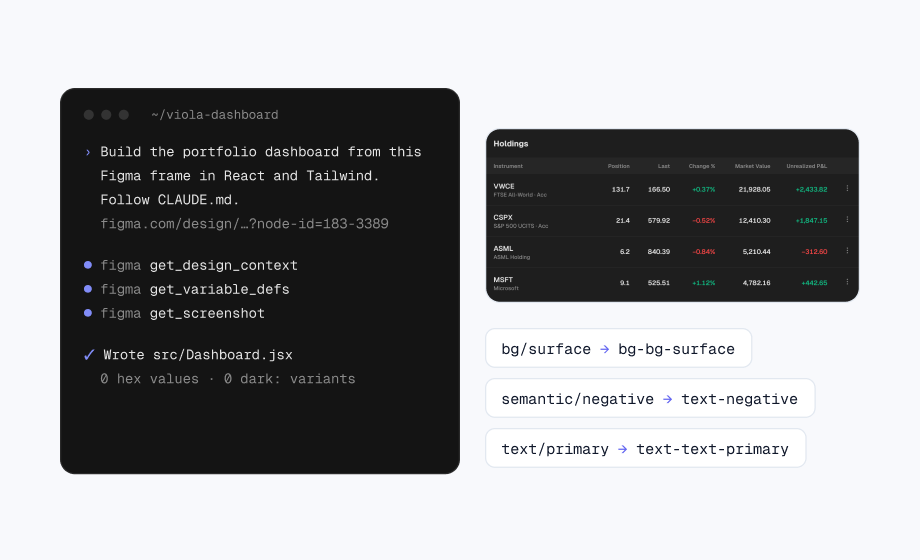
Right-aligned amounts line up by place value, so 21,928.05 and 4,782.16 can be compared by length at a glance. Align the column header with its numbers too.
Do: left-align instrument names, right-align every amount and its header.
3. Give every change a sign
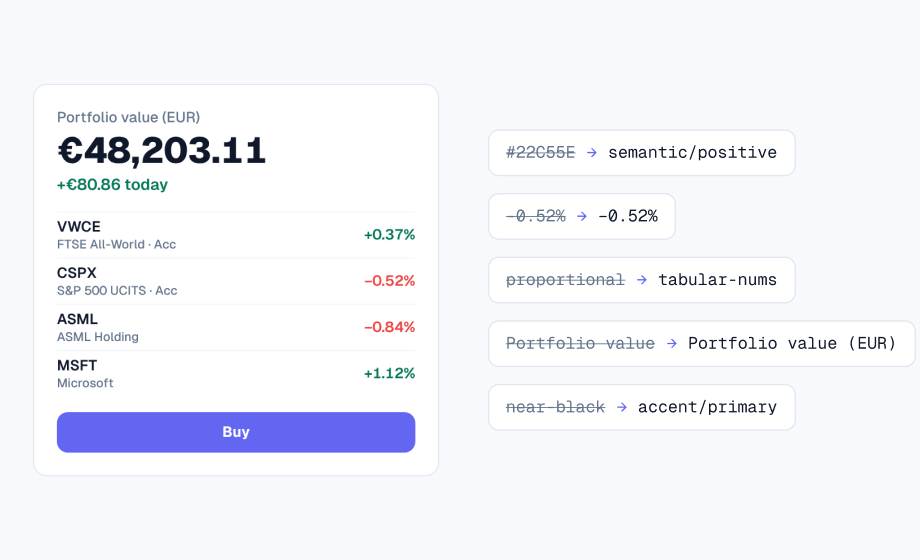
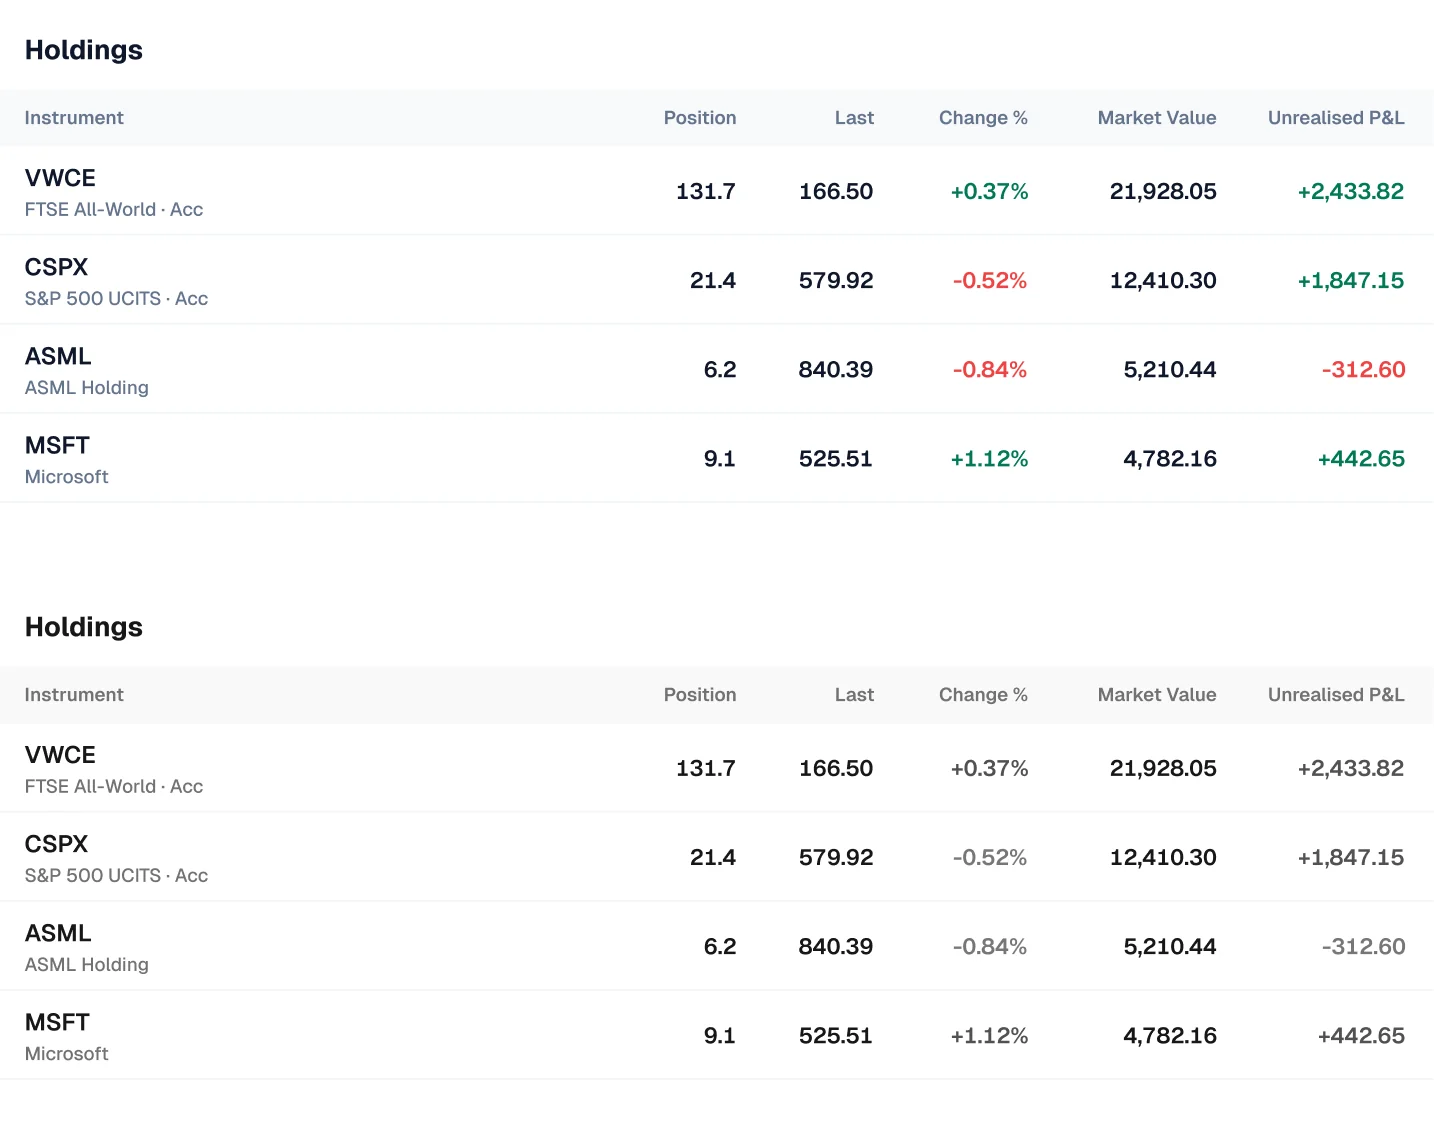
A coloured 0.84% on its own doesn’t say which way it moved, and colour alone fails people who can’t tell green from red. Show the sign, and for money show the amount and the percentage together.
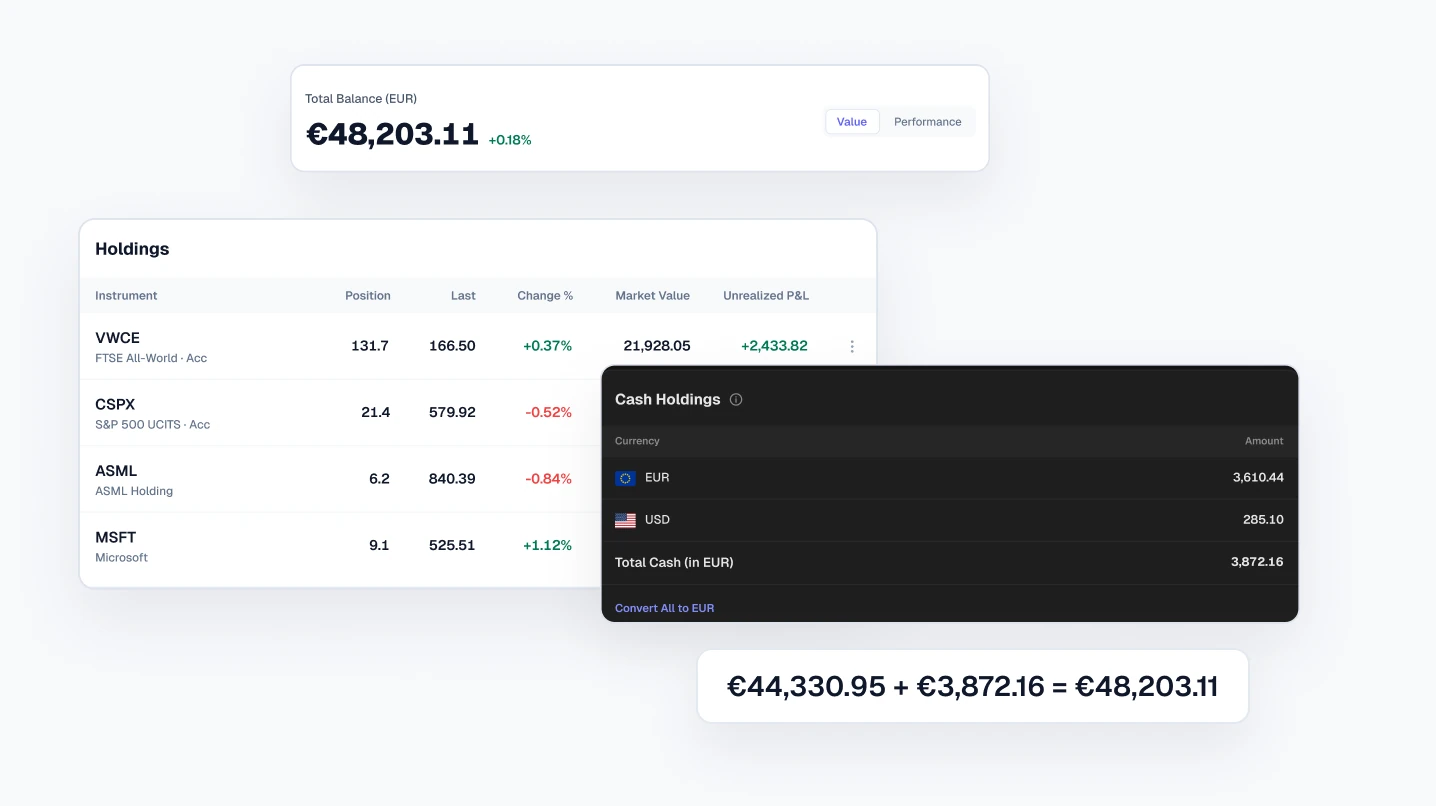
Do: write +€2,433.82 (+12.5%) and −0.84%, never a green 2,433.82.
4. Keep green and red for gains and losses
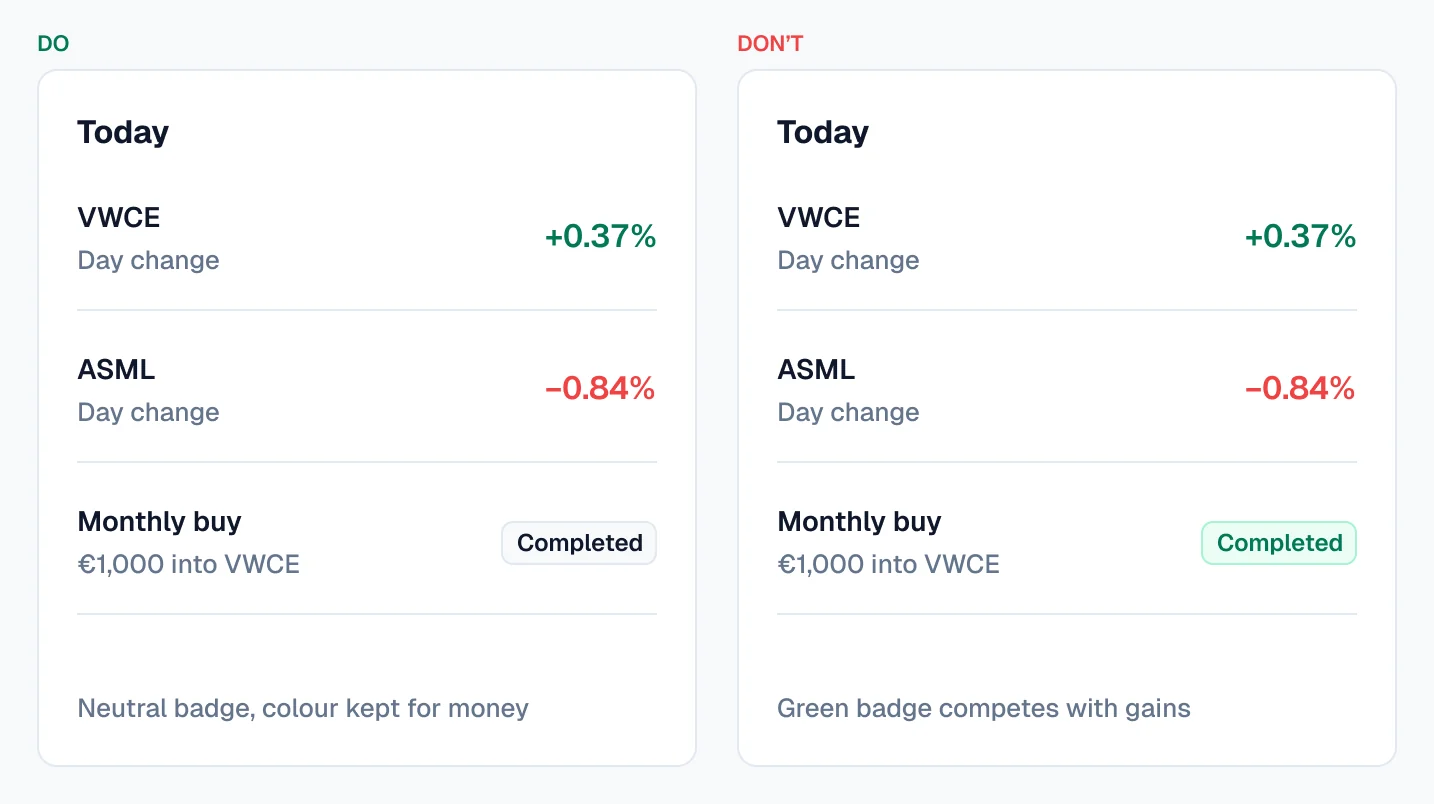
Green and red already mean money going up or down. Use them on a status badge, a chart series or a “Buy” button and they start sending mixed signals next to real P&L.
Do: keep badges neutral and give charts their own colours.
5. Keep the brand colour off amounts
An amount in the accent colour reads as a link or a highlight, not a value. Keep the brand colour for actions, links and selection, and set amounts in the normal text colour.
Do: €48,203.11 in primary text, “Place trade” in the accent.
6. Label the currency of every total
A total with no currency is a guess, especially when cash sits in more than one. Say the currency once per table or card, and label mixed totals.
Do: “Total cash (in EUR) €3,872.16”, with €3,610.44 and $285.10 shown separately.
7. Keep decimals consistent in each column
Two decimals for money and one or two for percentages, the same in every row. Quantities show what the account actually holds, such as 131.7 shares. Leave room for other formats: €48,203.11 in English is 48.203,11 € in Portuguese.
Do: pick one format per column and keep it.
8. Use a real minus sign
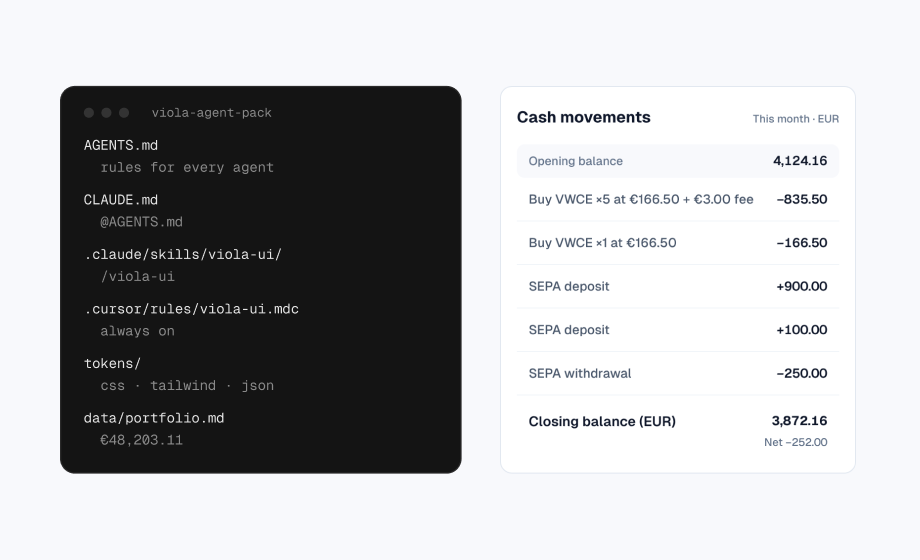
The hyphen (-) is shorter than the plus sign and sits too low, so −€835.50 and +€900.00 don’t line up. Use the minus sign (−, U+2212), which matches the width of +.
Do: −€835.50, not -€835.50.
9. Make totals equal their parts
The total is the first number people check. If the parts don’t add up to it, nothing else on the screen is believed. Draw every figure from one dataset.
Do: €44,330.95 in holdings + €3,872.16 in cash = €48,203.11, on every screen.
10. Show the numbers before money moves
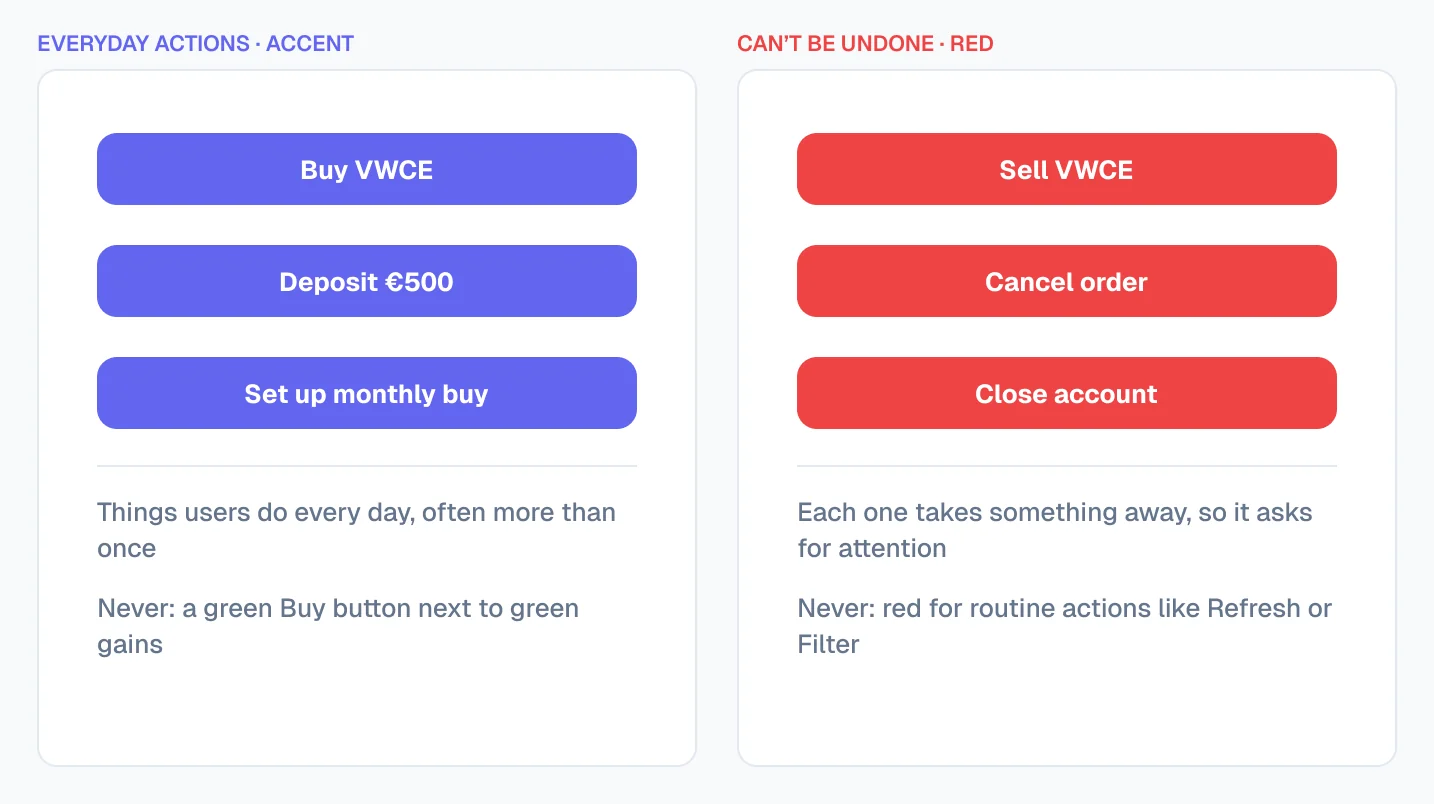
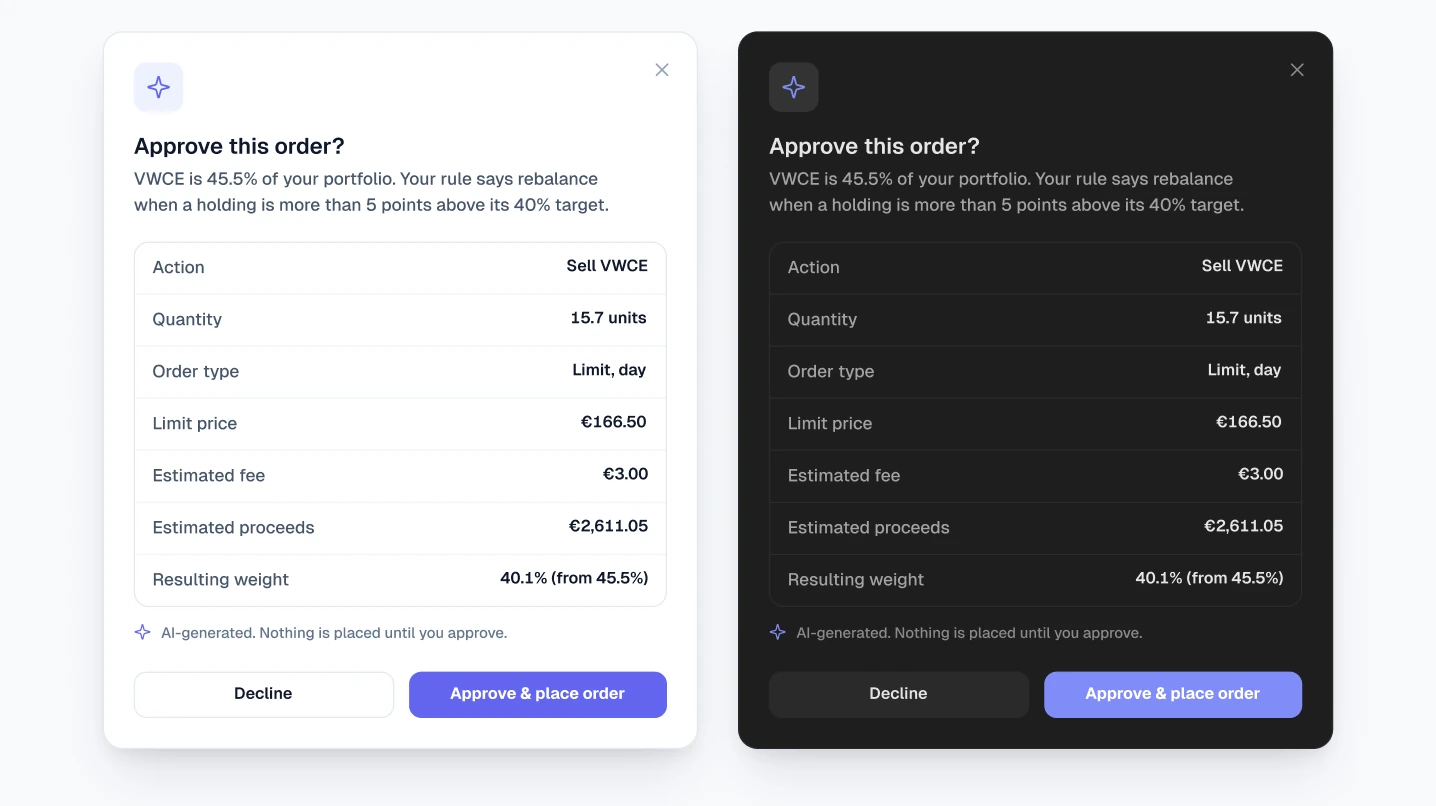
A confirmation should show what will happen, in figures: the amount, the fee and the result. Name the action on the button, and keep red for what can’t be undone.
Do: “Approve & place order” with the €3.00 fee and €2,611.05 proceeds above it.
The checklist
Copy this into your design review or your handoff notes:
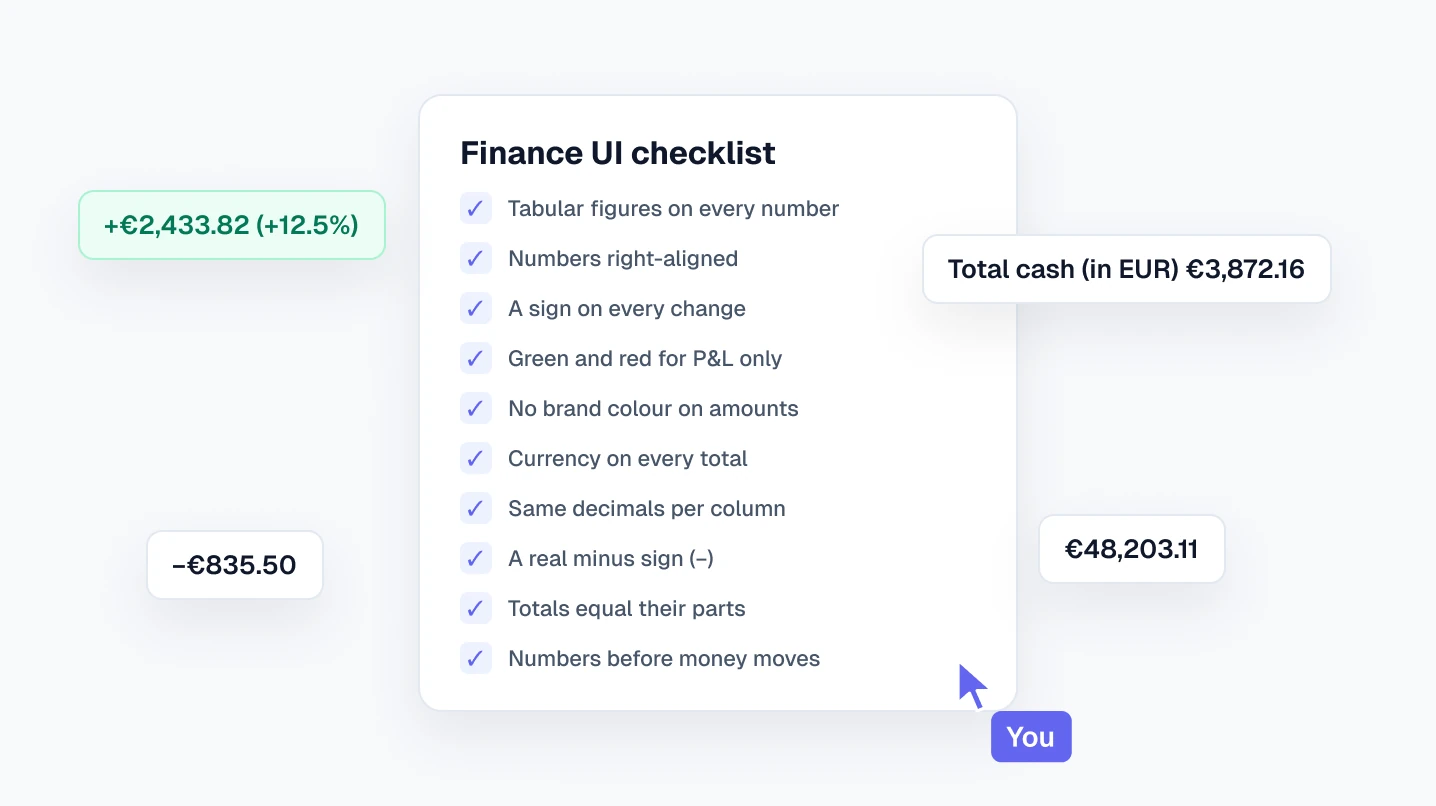
Finance UI checklist
- 1.Every number uses tabular figures.
- 2.Numbers and their headers are right-aligned; text is left-aligned.
- 3.Every change has a sign, and money changes show the amount and the percentage.
- 4.Green and red appear only on gains and losses.
- 5.The brand colour is never on an amount.
- 6.Every total says its currency; mixed currencies are labelled.
- 7.Each column uses one number of decimals.
- 8.Negative amounts use the minus sign (−), not a hyphen.
- 9.Totals equal the sum of their parts, on every screen.
- 10.Confirmations show the amount, the fee and the result before money moves.
Free Figma file with these rules built in
Viola UI’s free kit has these rules set up as styles and variables, so new screens follow them by default:
- 25 text styles, with tabular figures on every money style
- 45 colour tokens in Light and Dark, with green and red reserved for P&L
- 190+ component variants: buttons, table cells, tabs, tags, sidebar and charts
- The Portfolio dashboard, complete, in light and dark
Free for personal and commercial projects, including client work. Get the free Viola UI kit on Figma Community.
FAQ
What are tabular figures?
Digits that all have the same width, so numbers line up in columns. Most UI fonts include them as an alternative to the default proportional figures.
Should a “Buy” button be green?
Better not. Green next to money means a gain, so a green button blurs that meaning. Use the accent colour for actions, and red only for what can’t be undone.
Where should the currency go in a table?
Once, in the table title or the column header, such as “Holdings (EUR)”, unless rows mix currencies. Then show it on each amount.
Is the Viola UI kit free?
The Viola UI free kit is free on Figma Community for personal and commercial projects. The full kit, with 100+ screens, is $49 for one designer.
Need the whole product?
The full Viola UI kit applies these rules across 100+ screens in light and dark, including trading, transfers, fund research, settings and onboarding. $49 for one designer, $179 for your whole company.
Sources

WRITTEN BY
Kseniya Savitsyna
Product designer working on fintech & AI products, and the designer behind Viola UI.