A portfolio dashboard makes one promise: the numbers are right. The total at the top has to equal the holdings below it, the weights have to add up, and the same figure has to appear on every screen. When they don’t, the first person who checks stops trusting the rest.
The short version: write the dataset before you draw, derive every number from it, decide how you round, and check five sums before you share the file.
I design fintech interfaces and build Viola UI, a Figma kit where every screen runs on one portfolio. The examples below use that portfolio, and the free file at the end has the dashboard built from it.
Start with the dataset, not the screen
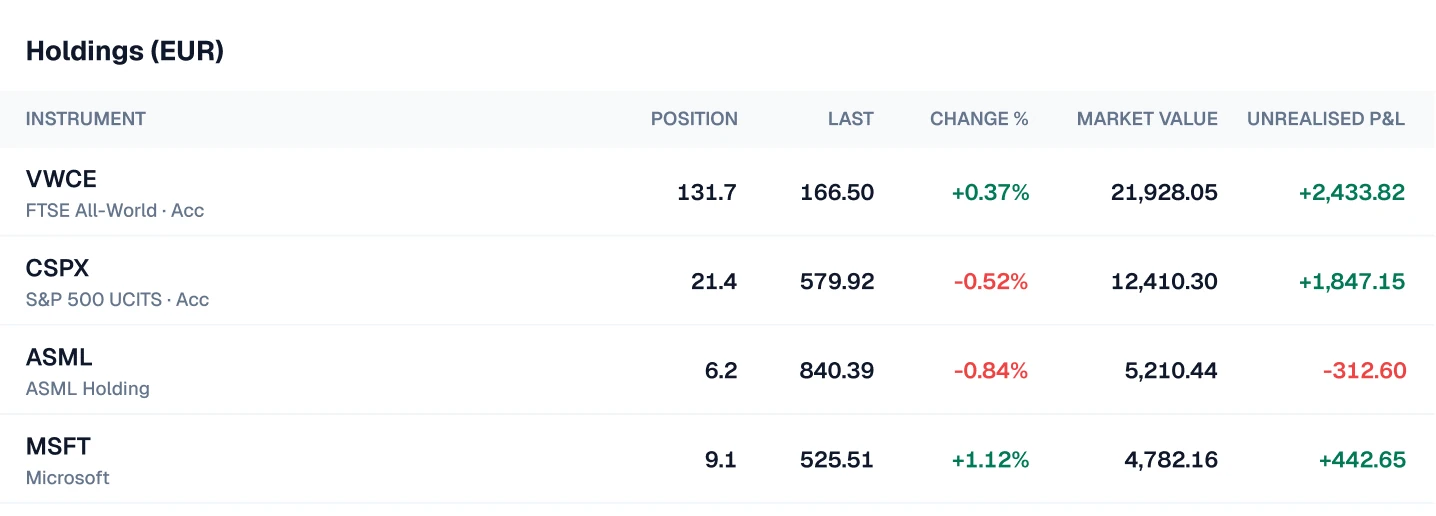
Most dashboards go wrong in the first hour, when someone types a believable balance into a card and moves on. Write the portfolio down first: what is held, how much, at what price, and how much cash, in which currency. Every number on every screen should come from that list.
| Holding | Market value | Weight |
|---|---|---|
| VWCE | €21,928.05 | 45.5% |
| CSPX | €12,410.30 | 25.7% |
| ASML | €5,210.44 | 10.8% |
| MSFT | €4,782.16 | 9.9% |
| Cash (EUR and USD) | €3,872.16 | 8.0% |
| Total | €48,203.11 | 100% |
This is the whole portfolio behind Viola UI. Four holdings worth €44,330.95, plus €3,872.16 in cash, make €48,203.11. Nothing on any screen is typed in by hand.
Derive every number, don’t type it
Once the dataset exists, most figures on a dashboard are arithmetic. Write the formula next to each one, at least for yourself:
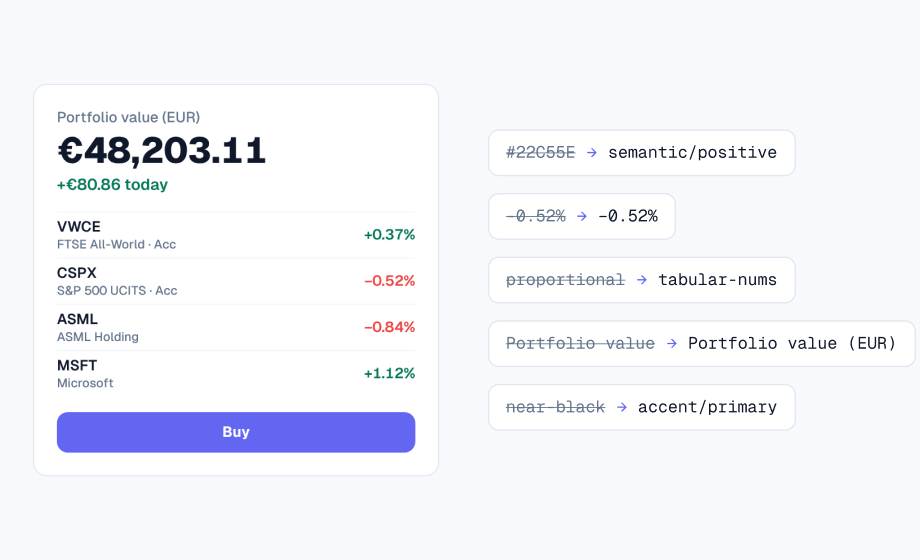
- Market value = quantity × price. 131.7 VWCE × €166.50 = €21,928.05.
- Unrealised P&L = market value − cost. 131.7 × €148.02 average cost is €19,494.23, so the gain is +€2,433.82 (+12.5%).
- Weight = market value ÷ total. €21,928.05 ÷ €48,203.11 = 45.5%.
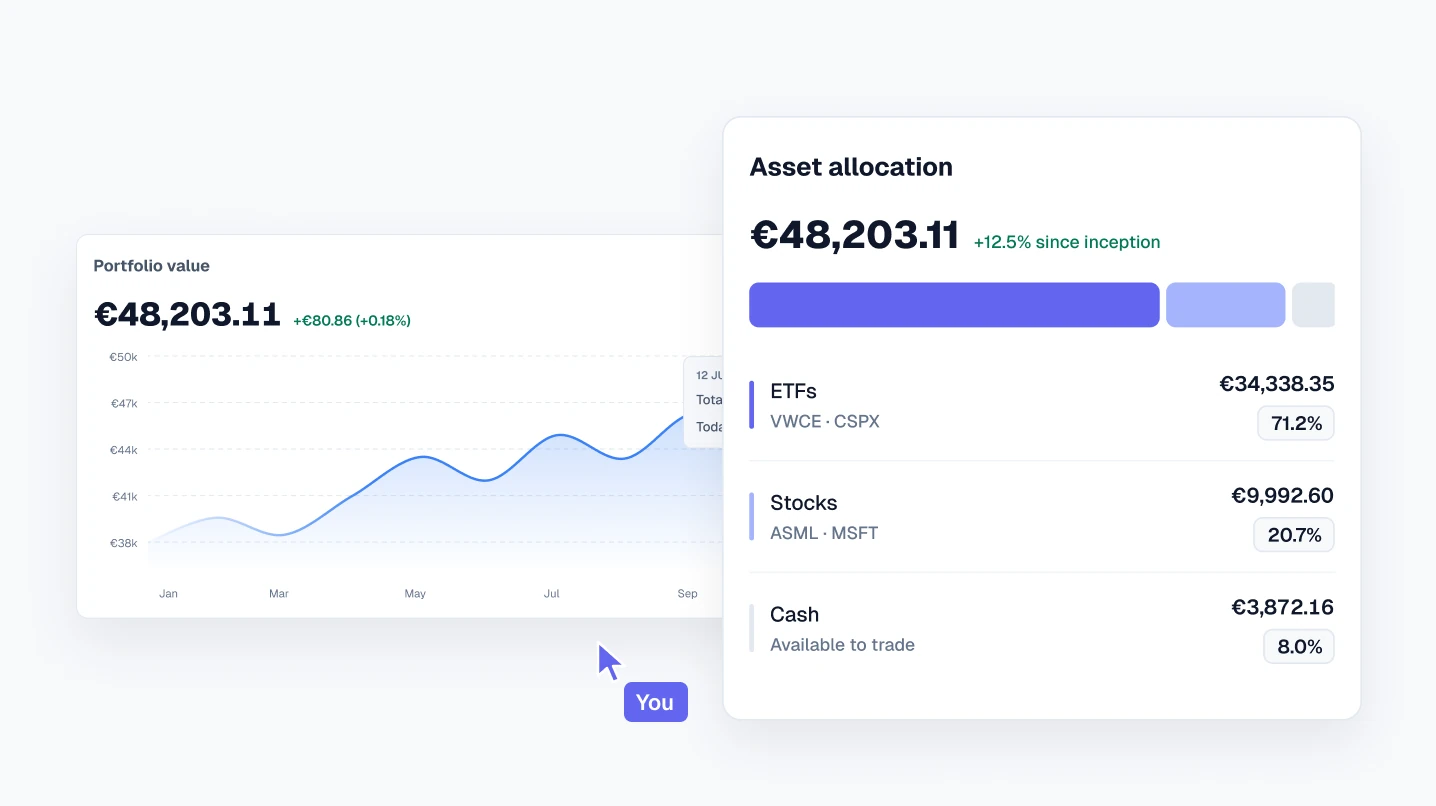
- Group totals = the sum of their holdings. VWCE and CSPX make €34,338.35 in ETFs; ASML and MSFT make €9,992.60 in stocks.
If a number can’t be traced back to the dataset with one of these formulas, it’s decoration. Remove it or connect it.
Make the total equal its parts
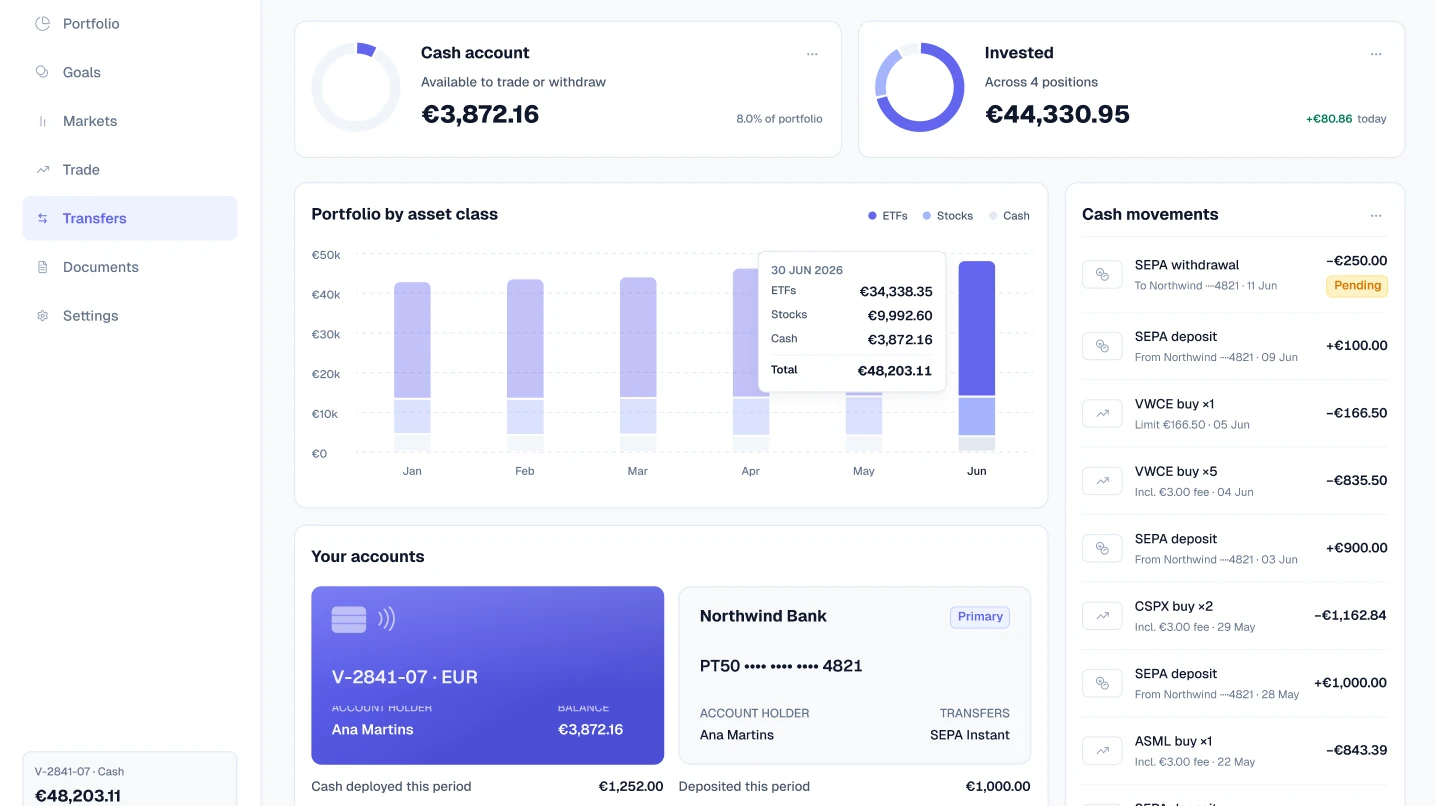
The top-line total is the number people check first. In Viola UI it can be split three ways, and all three agree:
- By holding: €21,928.05 + €12,410.30 + €5,210.44 + €4,782.16 + €3,872.16 cash = €48,203.11.
- By asset class: €34,338.35 in ETFs + €9,992.60 in stocks + €3,872.16 cash = €48,203.11.
- By account: €44,330.95 invested + €3,872.16 cash = €48,203.11.
Decide how you round
Rounding is where careful dashboards still disagree with themselves. Round each weight to one decimal and they add up to 99.9%: 45.5% + 25.7% + 10.8% + 9.9% + 8.0%. That’s correct maths, not a bug, so pick one rule and use it everywhere:
- Show the rounded weights as they are and calculate the 100% total from the full values, with a note if your users will add them up.
- Or adjust the largest weight so the rounded values sum to 100%, if your product team prefers that.
- Never change the money to fit a percentage. Amounts stay exact to the cent; only the percentages are rounded.
Show cash and currencies clearly
Cash is where totals often break, because it sits in more than one currency. In Viola UI the cash account holds €3,610.44 and $285.10. The dollars are converted to €261.72, so the total, labelled in euros, is €3,872.16.
- Name the currency of every total. “Total cash (in EUR)” leaves no doubt.
- Keep each balance in its own currency before converting, so users see what they actually hold.
- Use one exchange rate per screen and say when it was taken, so two cards never convert the same dollars differently.
Fees and cash movements have to close
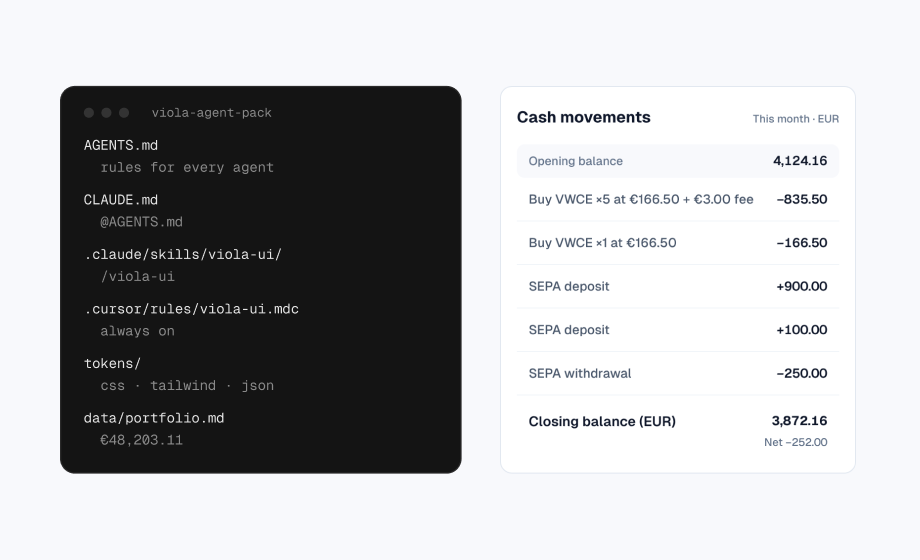
A trade changes two numbers: the holding goes up and the cash goes down, by the price plus the fee. Buying 5 VWCE at €166.50 costs €832.50, and with Viola UI’s flat €3.00 fee the cash account shows −€835.50.
Over a period, cash should close too. In June, €4,124.16 at the start, plus €1,000.00 in deposits, minus €1,252.00 spent and withdrawn, leaves €3,872.16, the cash on the dashboard.
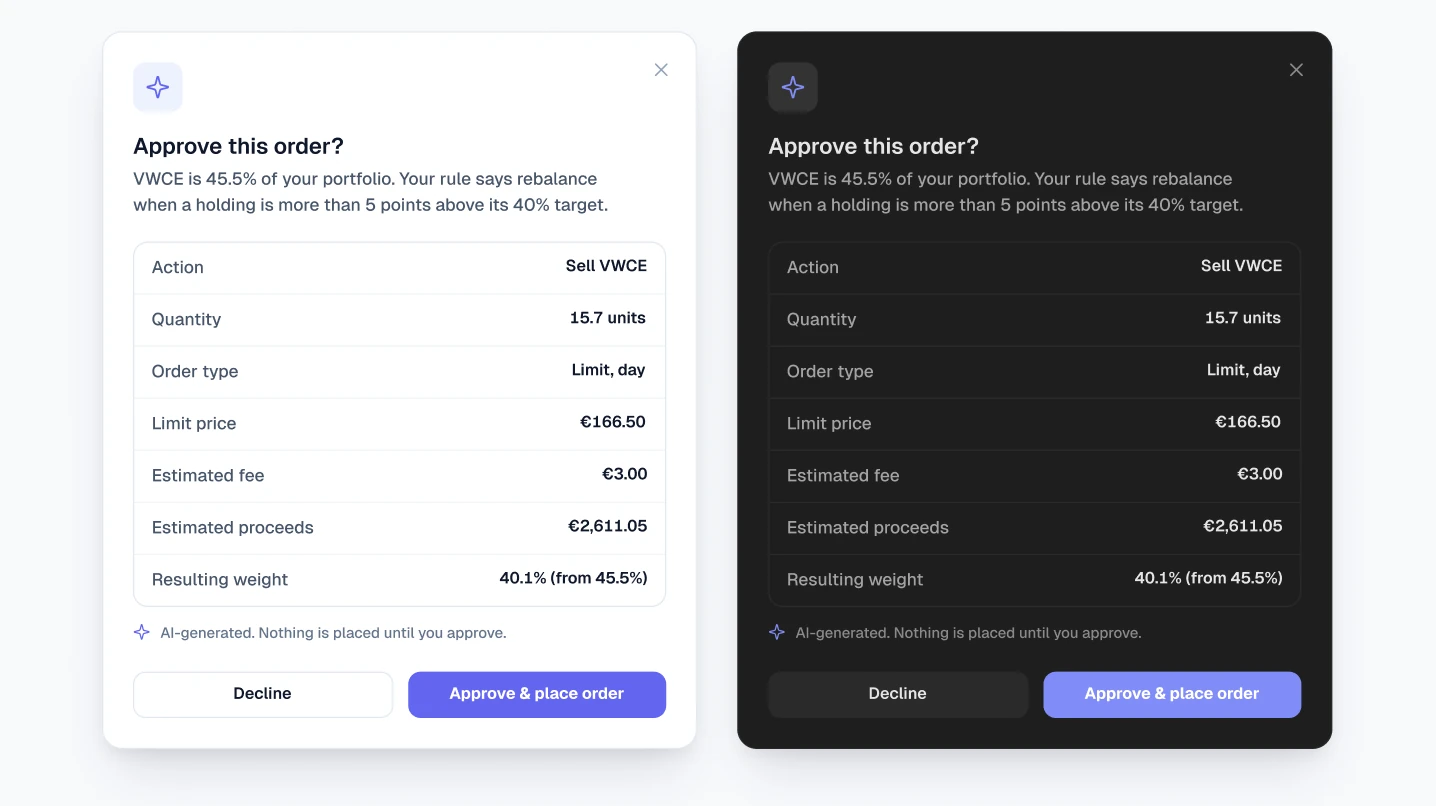
The same applies to AI. When Viola UI’s copilot proposes selling 15.7 VWCE, the approval shows the fee, the estimated proceeds of €2,611.05 and the weight after the trade, 40.1% instead of 45.5%.
Carry the same numbers to every screen
A dashboard is one screen of many. Users open a holding, place a trade or ask the copilot, and expect the same figures there. VWCE’s €21,928.05 is on the dashboard, in the holdings table and on the fund page, and its 45.5% weight is in the copilot’s answer. If it changes in one place, it has to change in all of them.
In Figma, keep the dataset in one place, such as a page or a text document, and update screens from it, not from each other.
Five checks before you share the file
- 1. Add up the total. Holdings plus cash equals the number at the top.
- 2. Recalculate one holding. Quantity times price equals its market value, within rounding.
- 3. Add up the weights. They come to 100%, or 99.9% with a rounding rule you can explain.
- 4. Close the cash. Opening balance plus money in, minus money out and fees, equals the cash shown.
- 5. Follow one number. Pick a holding and find it on every screen. It’s the same everywhere.
For type, colour and formatting, run the full finance UI checklist as well.
Free Figma file: Fintech Dashboard Kit
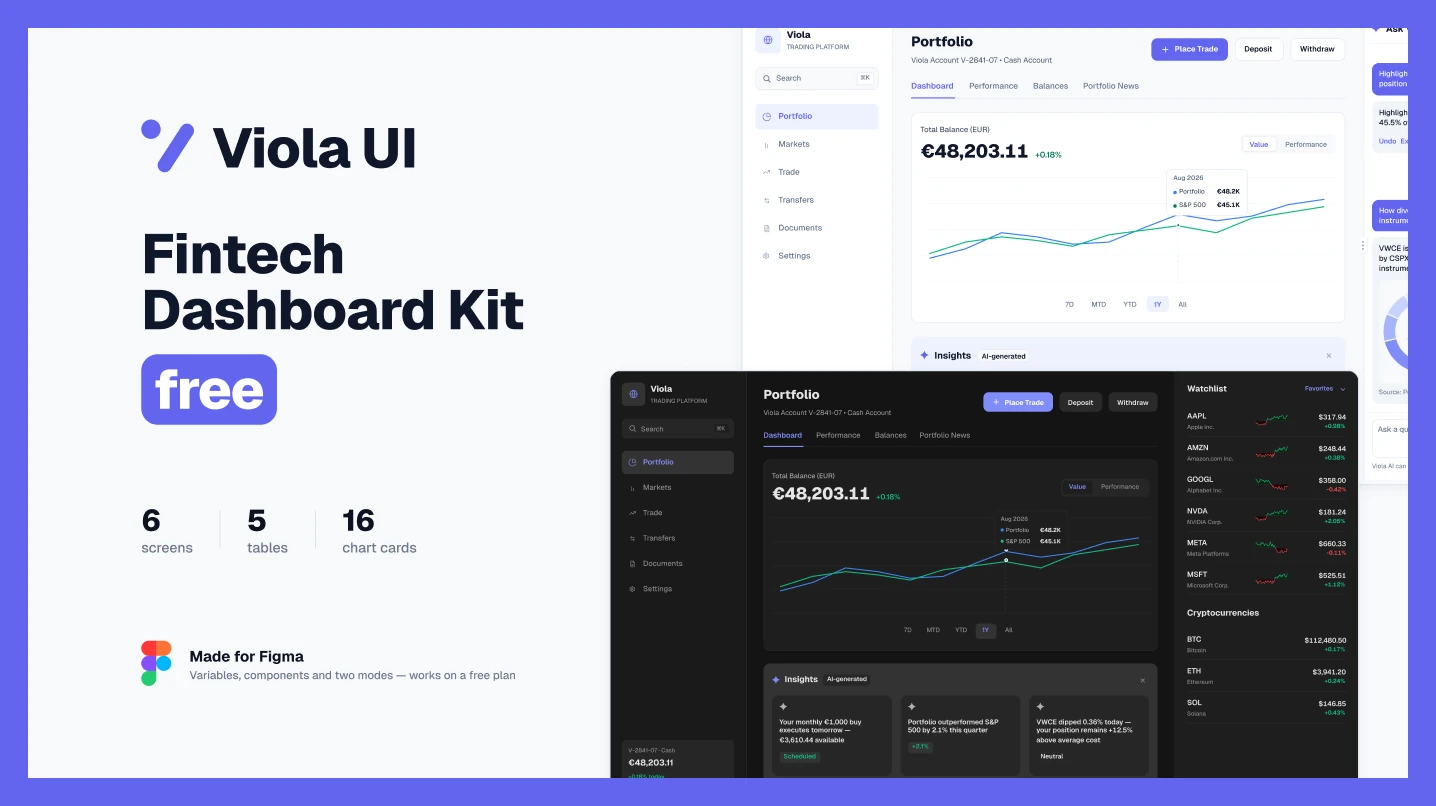
Everything in this guide is built into Viola UI’s free Fintech Dashboard Kit. Every number comes from one portfolio, so the dashboard, tables and charts all agree.
- Portfolio dashboard and 5 AI copilot screens, each in light and dark
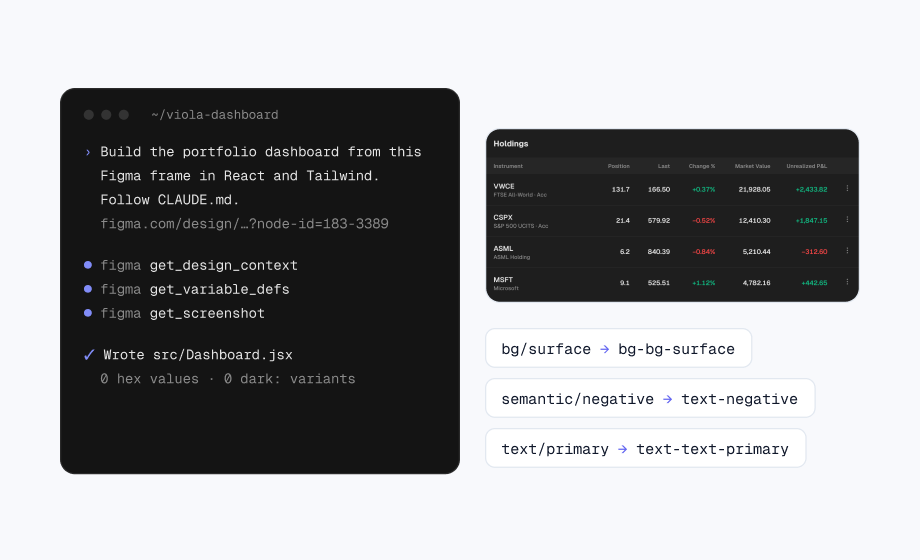
- 5 tables built from real table cells: stock listing, watchlist, top 10 holdings, holdings, transaction history
- 16 chart cards: lines, areas, bars, donuts, rings, candlesticks, money in and out
- AI components: insights strip, market brief, copilot chat panel
- 45 colour tokens in Light and Dark, 25 text styles in Geist
Get the free Fintech Dashboard Kit on Figma Community. Switching between light and dark works on a free Figma plan.
FAQ
Why don’t my portfolio weights add up to 100%?
Because each weight is rounded on its own. Five weights rounded to one decimal can sum to 99.9% or 100.1%. Either show them as they are or adjust the largest one, and keep the amounts in euros exact.
What sample data should a portfolio dashboard use?
One realistic portfolio that every screen draws from: a few holdings with quantities, prices and average costs, cash in each currency, and a short history of trades and transfers. Don’t use real people’s data.
How should a dashboard show more than one currency?
Show each balance in its own currency, convert at one rate per screen, and label the total with its currency, such as “Total cash (in EUR)”.
Is the Fintech Dashboard Kit free?
Yes. It’s free on Figma Community, and switching between light and dark works on a free Figma plan.
Need the whole product?
The full Viola UI kit carries this portfolio across 100+ screens in light and dark, including trading, transfers, fund research, settings and onboarding. $49 for one designer, $179 for your whole company.

WRITTEN BY
Kseniya Savitsyna
Product designer working on fintech & AI products, and the designer behind Viola UI.