5 screens · light and dark
Dashboards
Five dashboard layouts for the same account, from a summary with a full holdings table to an exposure view by region. Each one reads from account V-2841-07, so the €48,203.11 total, the four positions and the €3,872.16 in cash are the same on every layout.
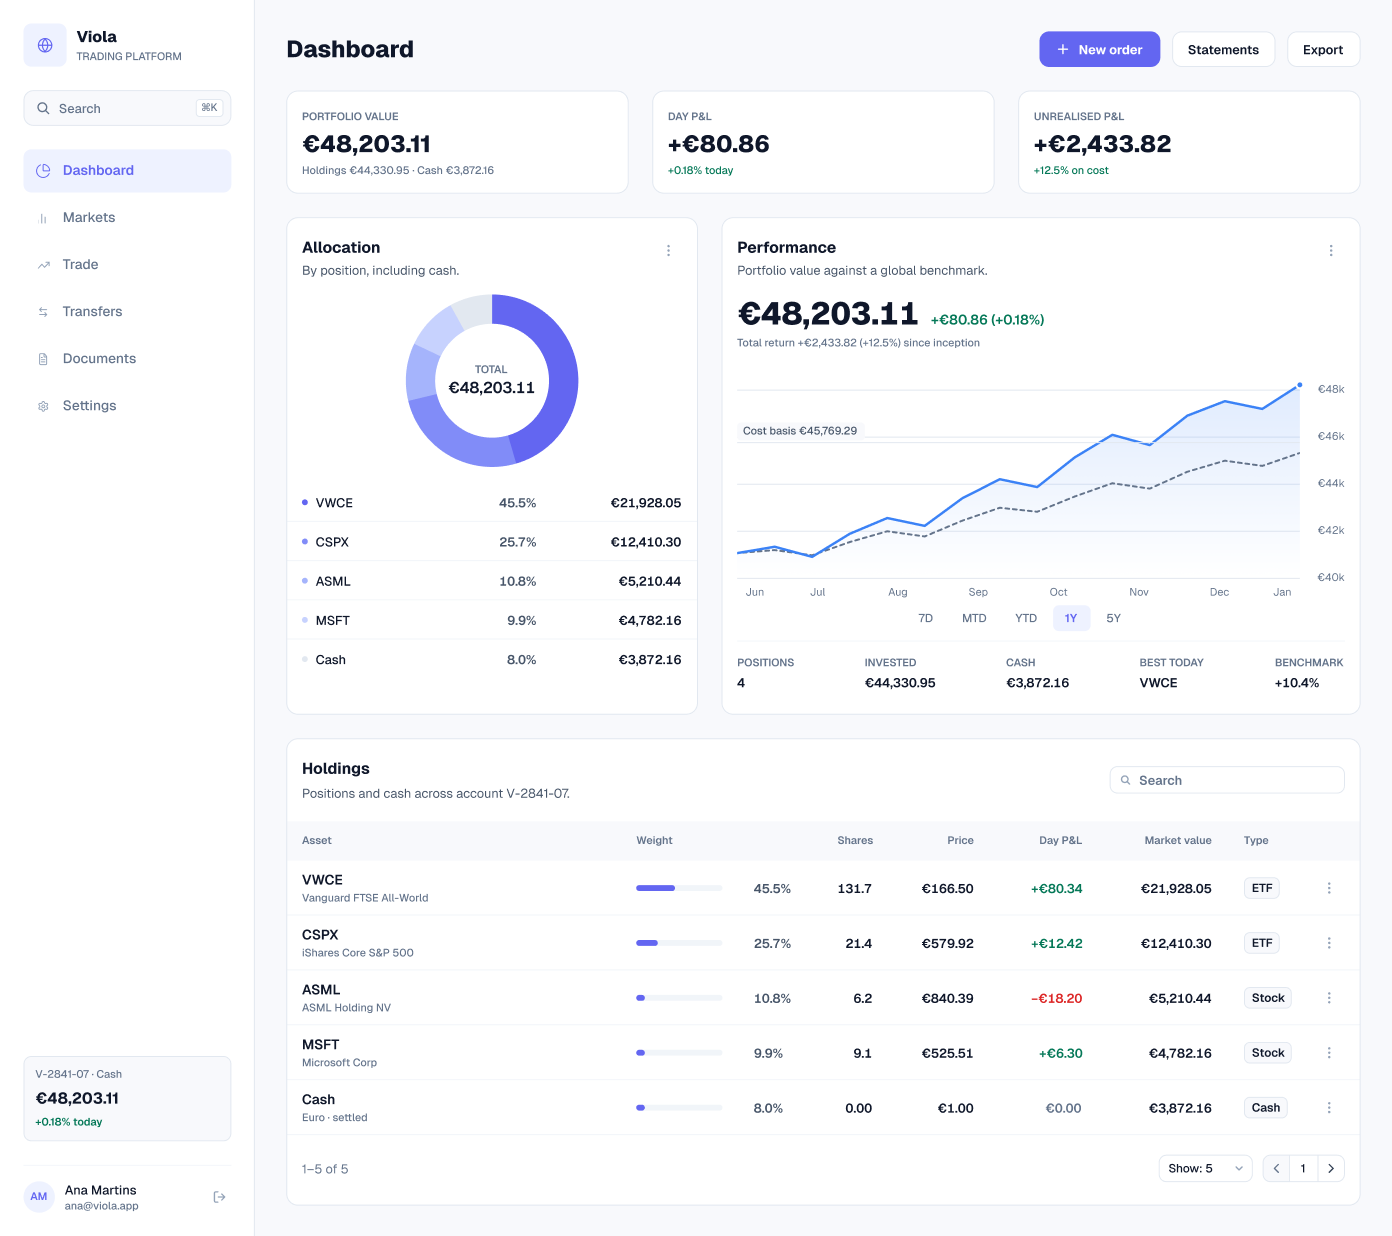
Summary dashboard
Three figures lead the page: portfolio value, split into holdings of €44,330.95 and cash of €3,872.16, then day P&L of +€80.86 and unrealised P&L. Below them sit an allocation donut by position, including cash, and a performance chart against a global benchmark with the cost basis marked.
A paginated holdings table closes the page, with each position’s type, weight, shares, price, day P&L and market value.
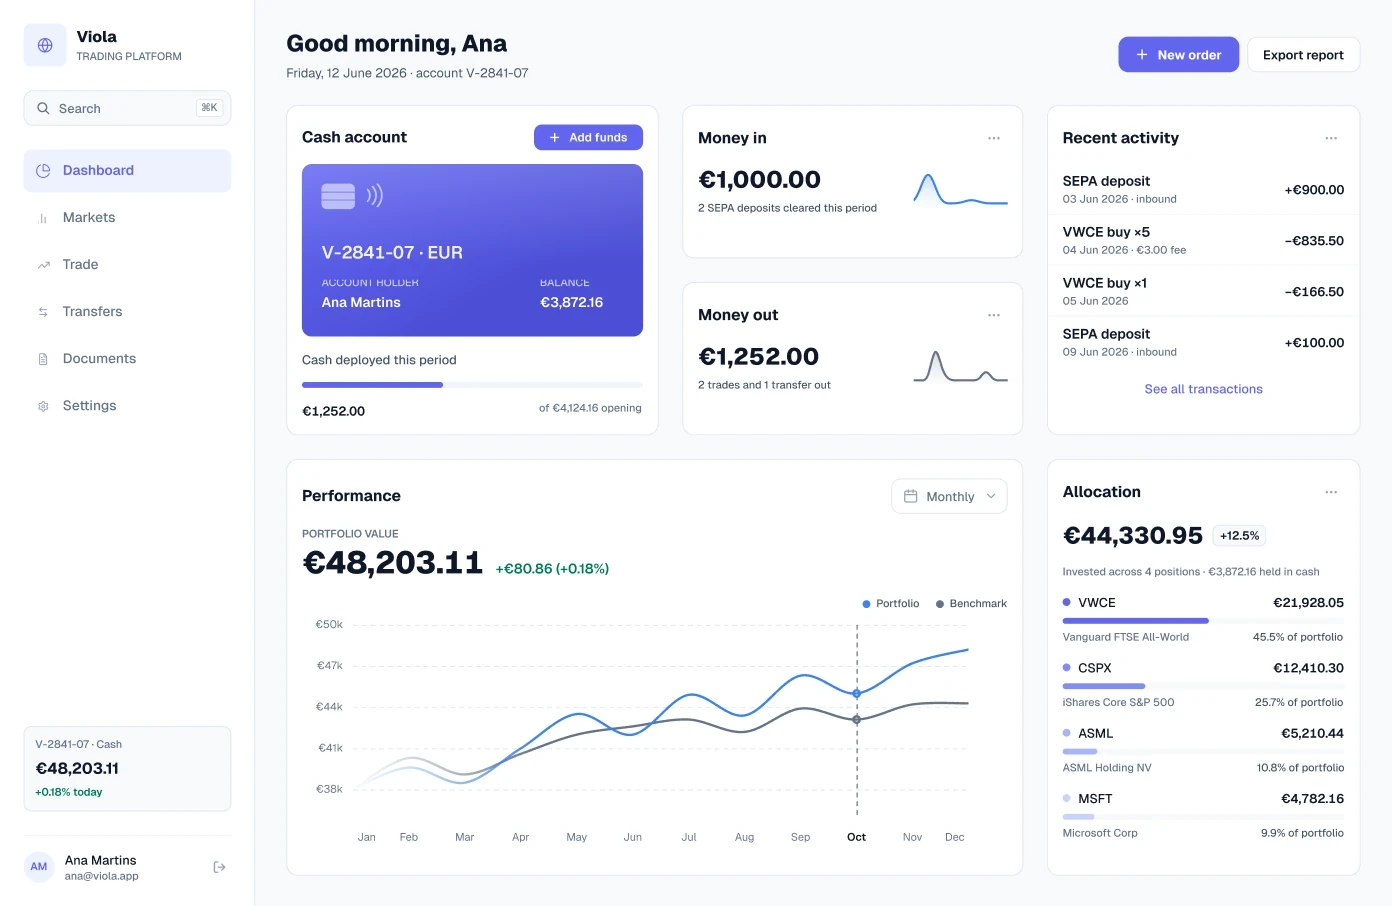
Home dashboard
A home screen that starts with a greeting, the date and the account. The cash account card shows the €3,872.16 balance and how much was deployed this period: €1,252.00 of the €4,124.16 opening balance. Recent activity lists the same SEPA deposits and VWCE buys as the cash ledger, and allocation cards show each position’s value and weight.
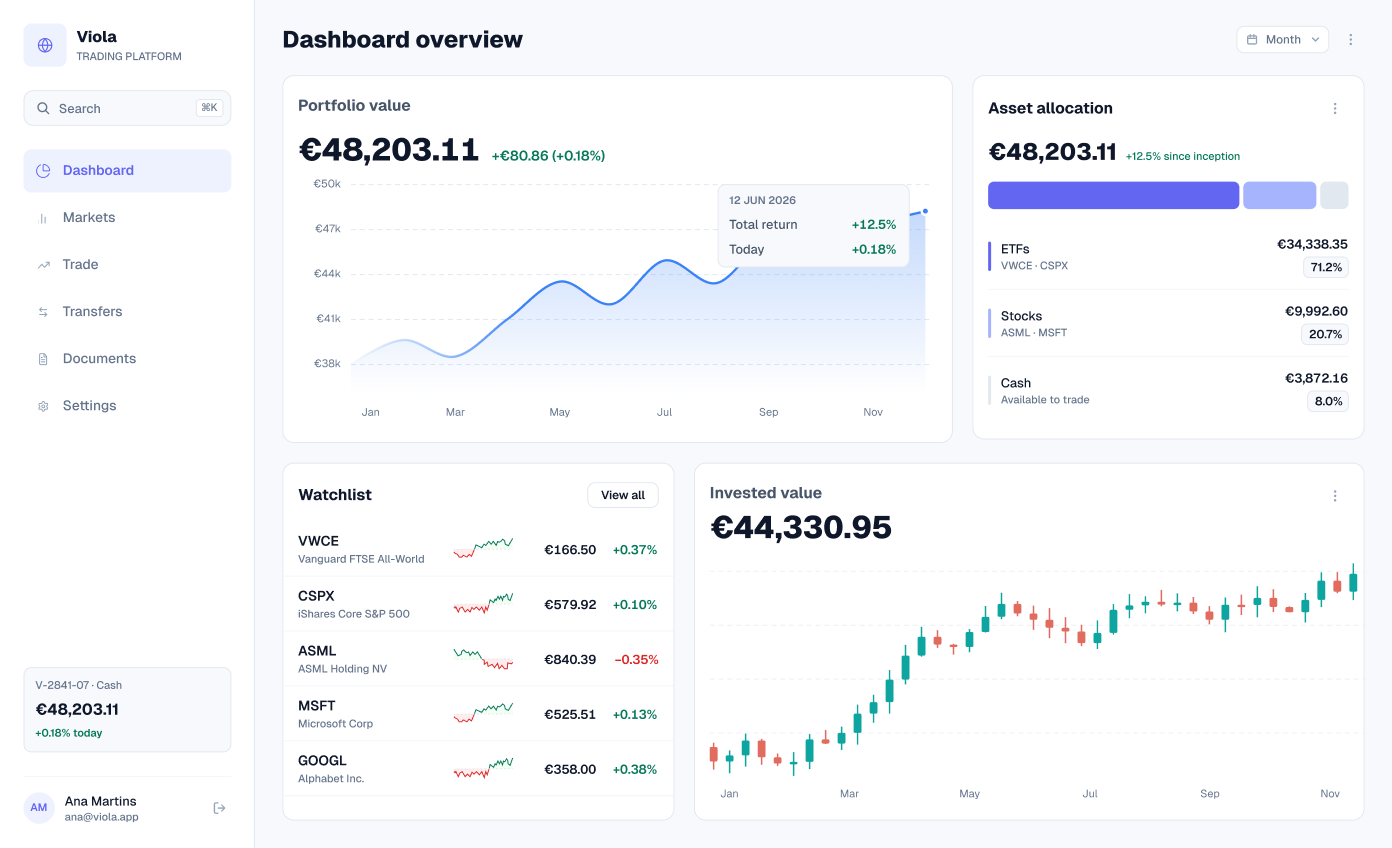
Dashboard overview
A compact overview: a portfolio value chart, asset allocation split into ETFs (VWCE and CSPX, €34,338.35, 71.2%), stocks (ASML and MSFT, €9,992.60, 20.7%) and cash (€3,872.16, 8.0%), and a watchlist of five instruments.
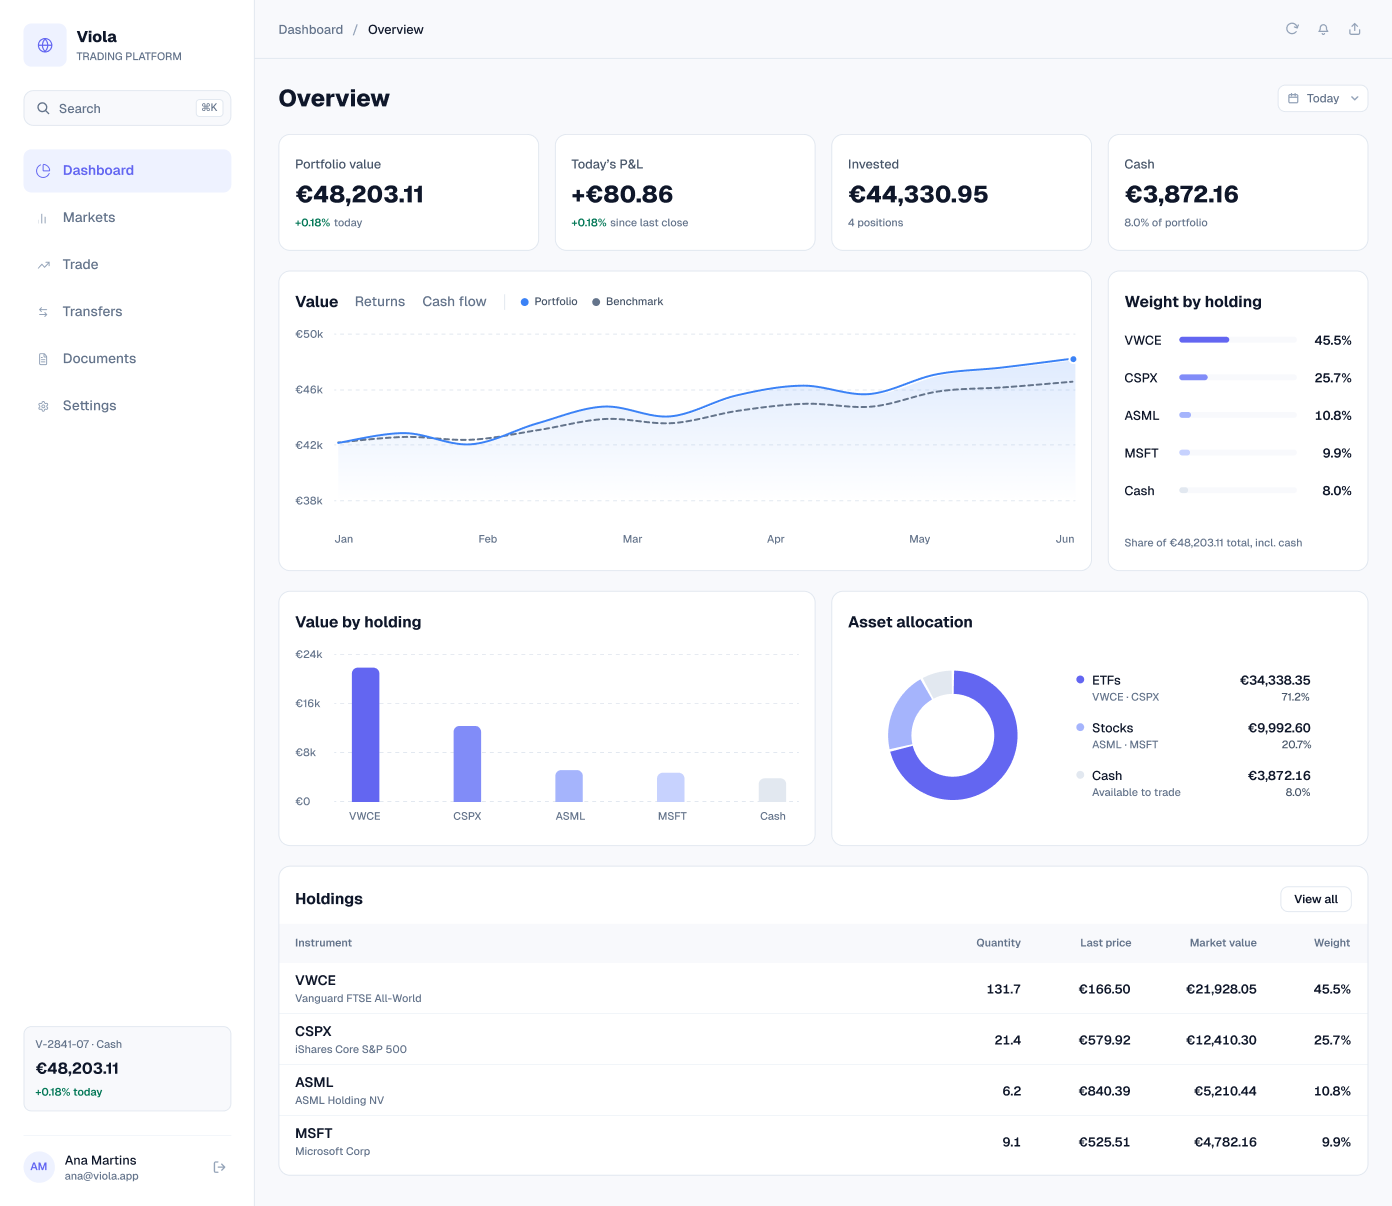
KPI overview
Four KPI cards: portfolio value, today’s P&L of +€80.86, €44,330.95 invested across 4 positions, and €3,872.16 in cash, 8.0% of the portfolio. A chart with Value, Returns and Cash flow views sits below, followed by weight and value by holding, asset allocation and a holdings table.
Exposure dashboard
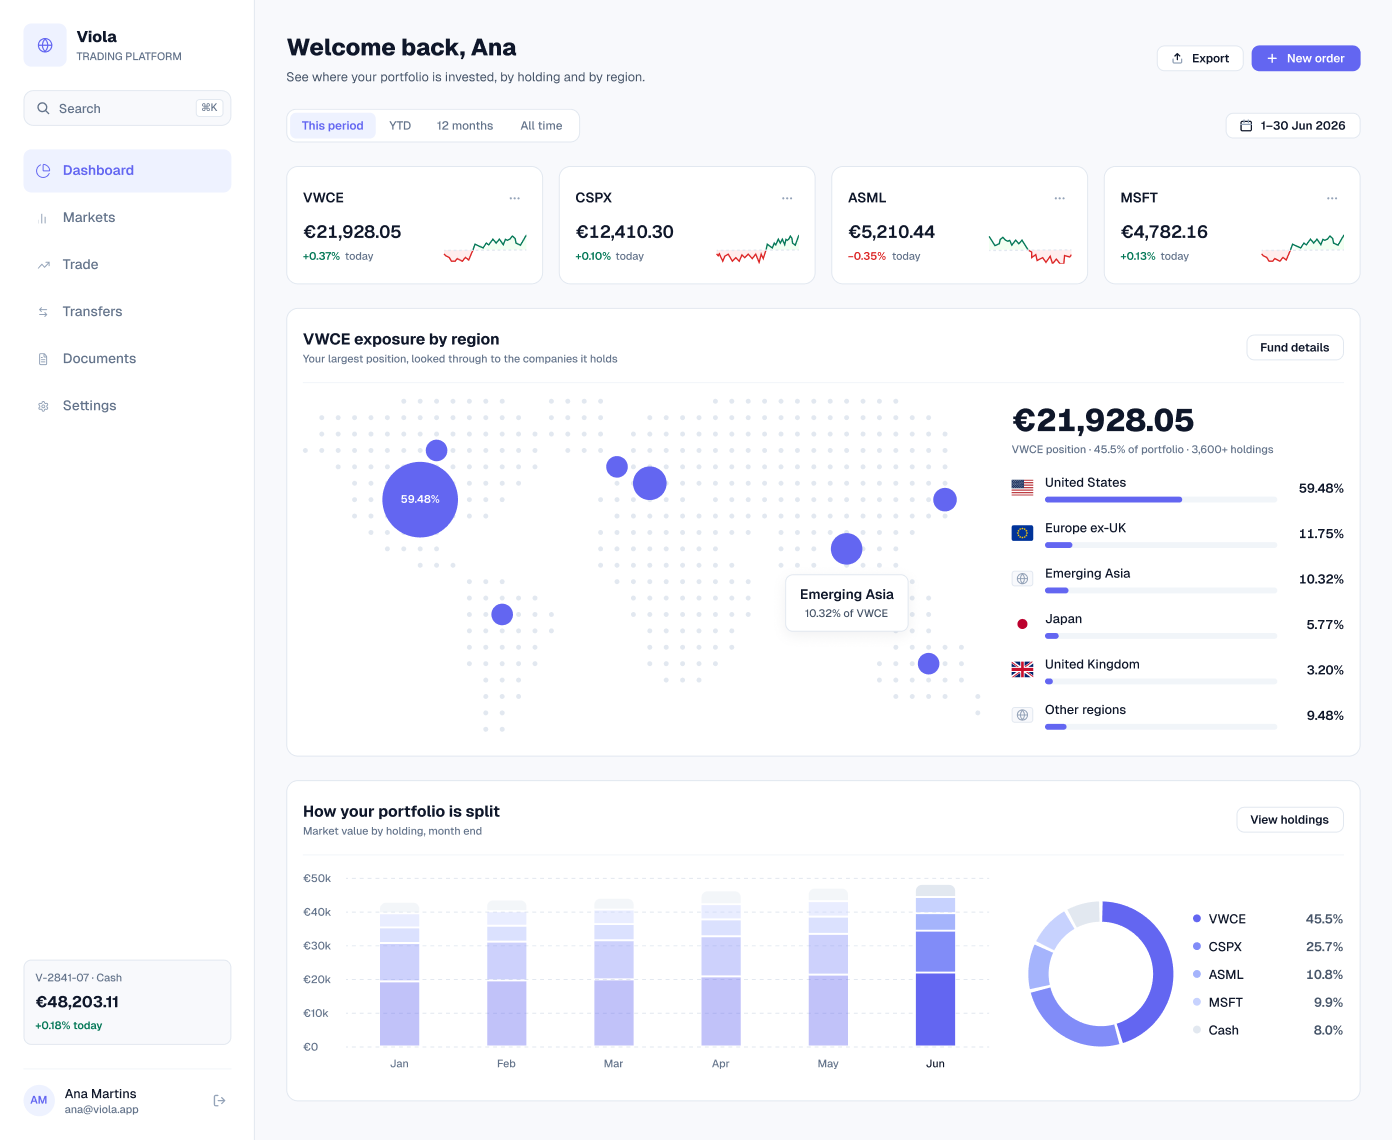
Where the money is invested. Each position has a card with its value and today’s move. VWCE, the largest position, is then looked through to the regions it holds: United States 59.48%, Europe ex-UK 11.75%, Emerging Asia 10.32%, Japan 5.77%, United Kingdom 3.20% and other regions 9.48%.
A stacked chart shows market value by holding at each month end.
Screens at a glance
| Screen | What it shows | Built from |
|---|---|---|
| Summary dashboard | Value, P&L, allocation, performance and holdings | sidebar, range-pill, input, paginator, table/cell |
| Home dashboard | Greeting, cash account, activity and allocation | sidebar, select, tag, progress-bar, table/cell |
| Dashboard overview | Value chart, asset allocation and watchlist | sidebar, select, tag, table/cell |
| KPI overview | Four KPIs, charts and holdings | sidebar, select, table/cell |
| Exposure dashboard | Position cards and VWCE by region | sidebar, range-pill, sparkline, button |
Data that agrees
Every layout splits the same €48,203.11. The ETFs are VWCE and CSPX, the stocks are ASML and MSFT, and the cash is the €3,872.16 in the cash account. The same figures appear on the Dashboard overview and the KPI overview.
| Type | Holdings | Weight | Market value (EUR) |
|---|---|---|---|
| ETFs | VWCE · CSPX | 71.2% | 34,338.35 |
| Stocks | ASML · MSFT | 20.7% | 9,992.60 |
| Cash | EUR and USD | 8.0% | 3,872.16 |
| Total | 100% | 48,203.11 |
Built from
The five screens are built from Viola components, so a change in the library reaches every screen. Counts are for the light screens.
| Component | Instances | Used on | What it does |
|---|---|---|---|
| table/cell | 122 | Four of five | Holdings, watchlist and allocation rows |
| button | 29 | All five | New order, export and card actions |
| range-pill | 9 | Summary, Exposure | Chart and period ranges |
| sidebar | 5 | All five | App navigation and the account card |
| tag | 4 | Home, Overview | Status and category labels |
| sparkline | 4 | Exposure | Each position’s trend |
| select | 3 | Home, Overview, KPI | Dropdown filters |
| input | 1 | Summary | Holdings search |
| paginator | 1 | Summary | Holdings paging |
| progress-bar | 1 | Home | Cash deployed this period |
Get the file
The Dashboards screens are in the full Viola UI kit, with 100+ screens in light and dark. Open the Figma preview to see them all, or get the kit for $49.