5 screens · light and dark
Fund page
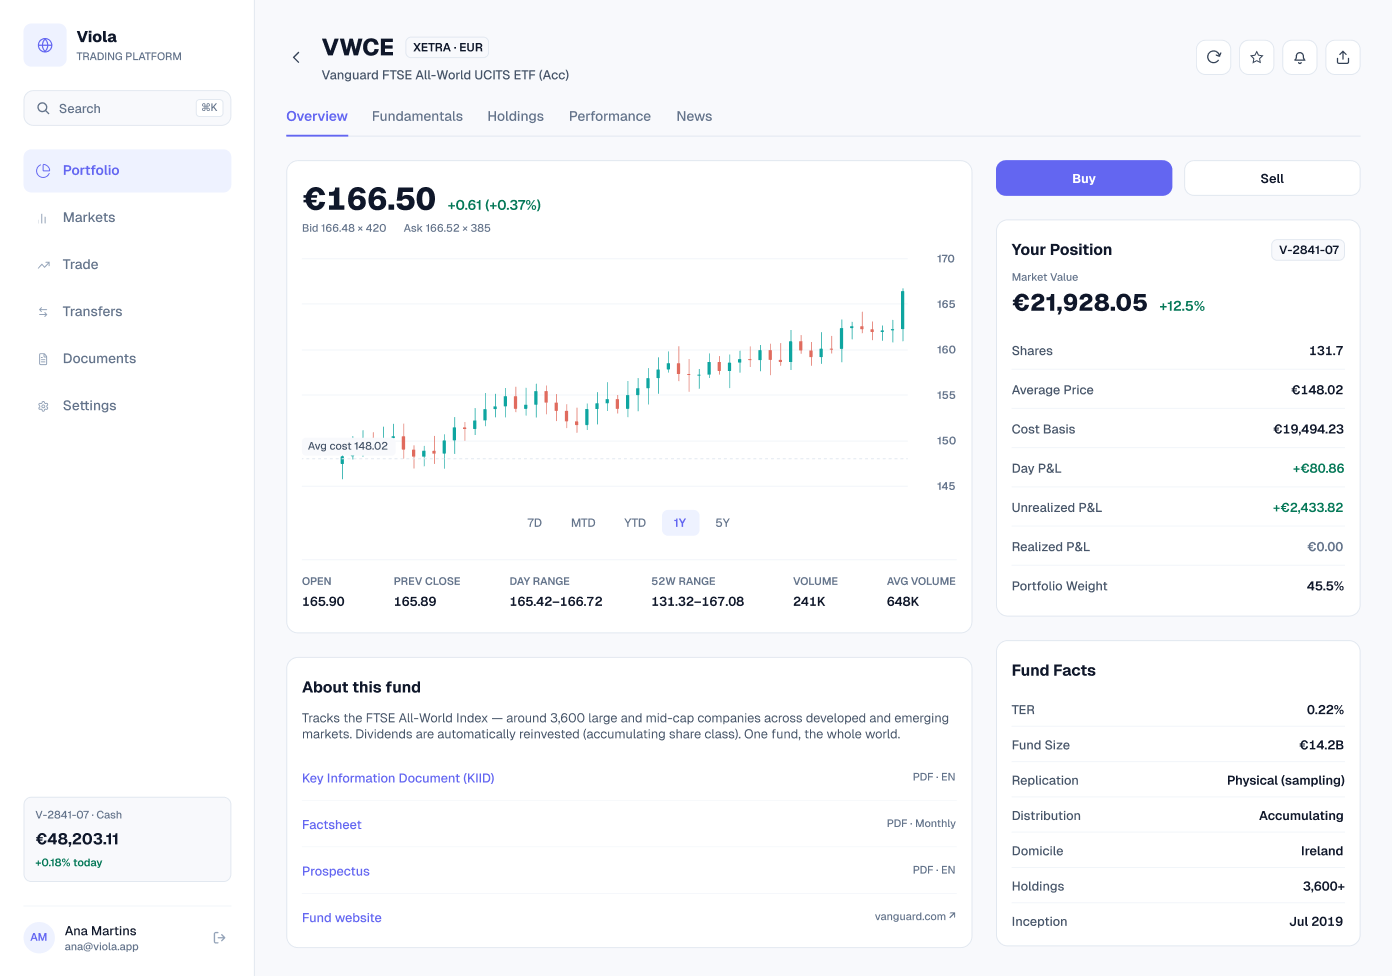
A fund page for VWCE, the Vanguard FTSE All-World UCITS ETF (Acc), across five tabs: overview, fundamentals, holdings, performance and news. It’s the customer’s largest position, so their 131.7 shares and €21,928.05 market value appear here exactly as in the portfolio.
Overview
The quote at €166.50, +0.61 (+0.37%), with bid and ask, a price chart with the customer’s €148.02 average cost marked, and the day’s trading figures. Beside it sits the customer’s position: 131.7 shares, a cost basis of €19,494.23, a market value of €21,928.05 and 45.5% of the portfolio.
Fund facts follow: a TER of 0.22%, €14.2B in size, physical sampling, accumulating, domiciled in Ireland, with links to the KIID, factsheet and prospectus.
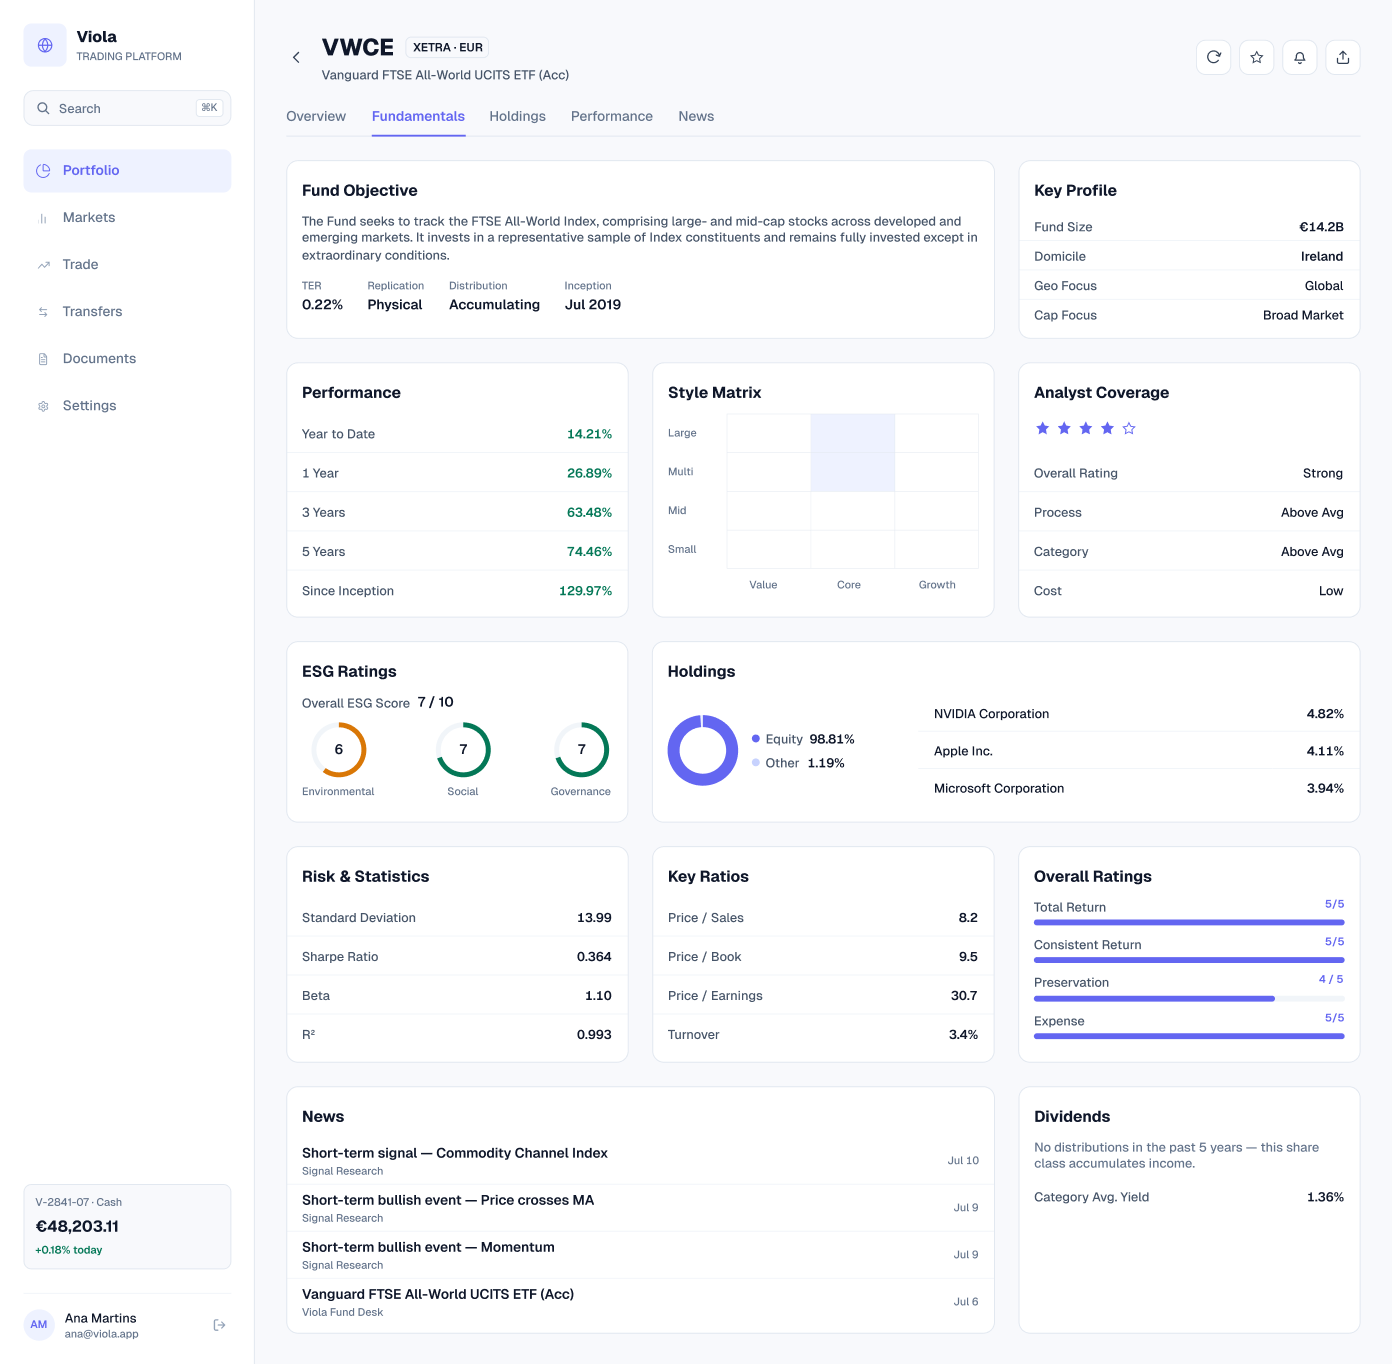
Fundamentals
The fund objective, key profile and trailing returns, from 14.21% year to date to 129.97% since inception. Then a style matrix, analyst and ESG ratings, risk statistics, key ratios and recent signal research. The dividends card explains why it’s empty: the share class accumulates income.
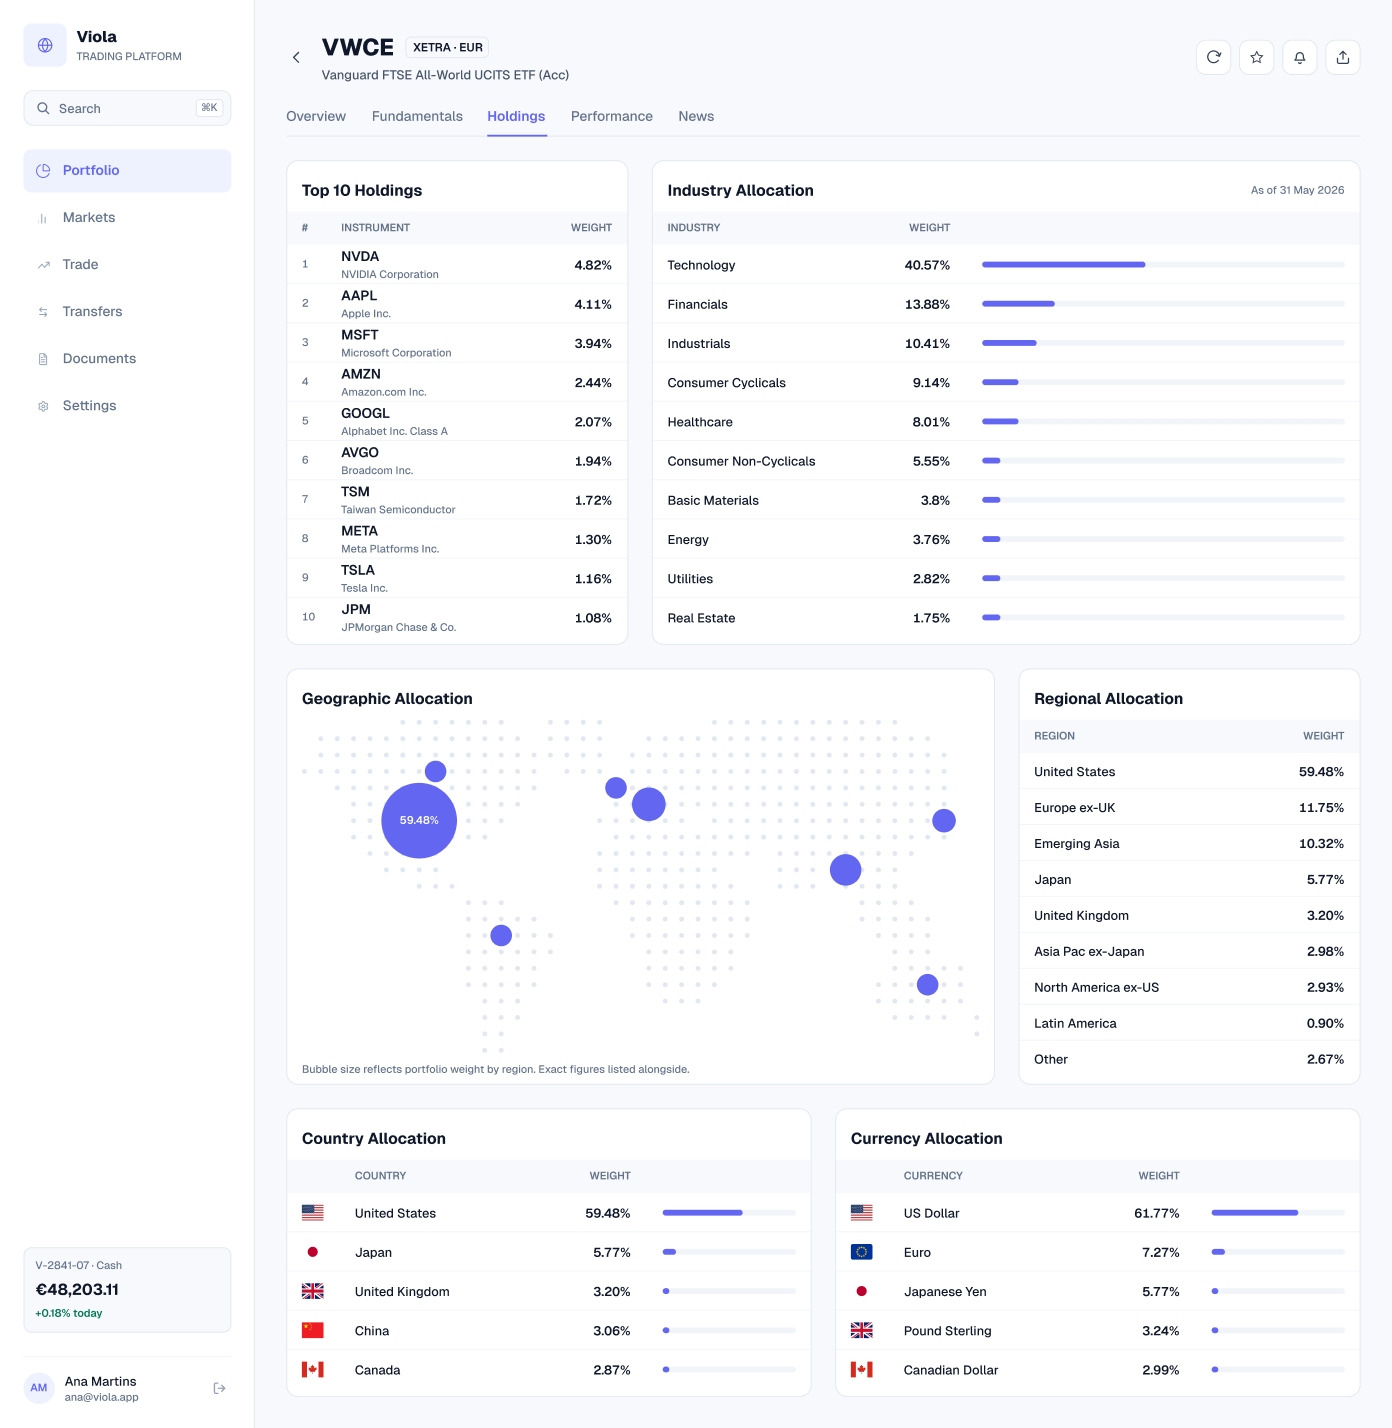
Holdings
The top 10 holdings, led by NVIDIA at 4.82%, Apple at 4.11% and Microsoft at 3.94%, then allocation by industry, region, country and currency. Technology is 40.57% of the fund and the United States 59.48%.
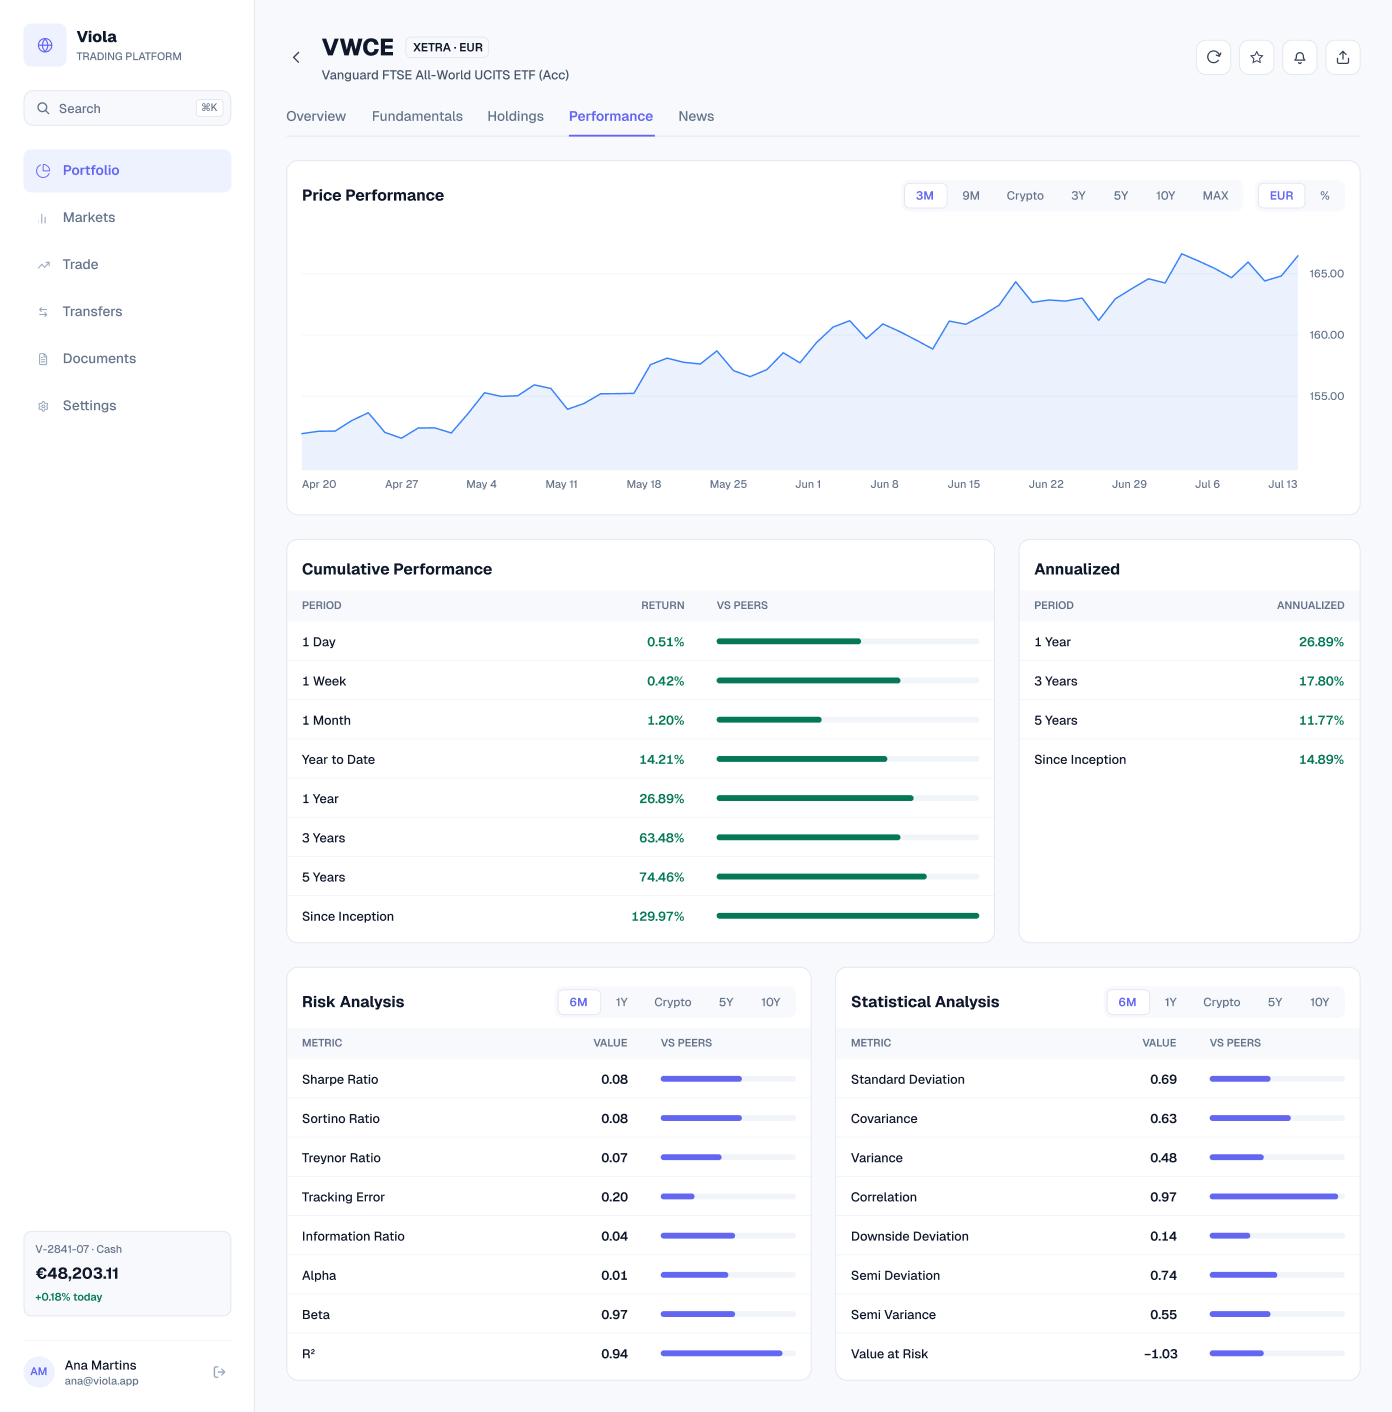
Performance
A price chart with ranges up to the maximum, cumulative returns from 1 day to since inception, annualised returns, and risk and statistical analysis: Sharpe, Sortino and Treynor ratios, tracking error, alpha, beta, value at risk and more.
News
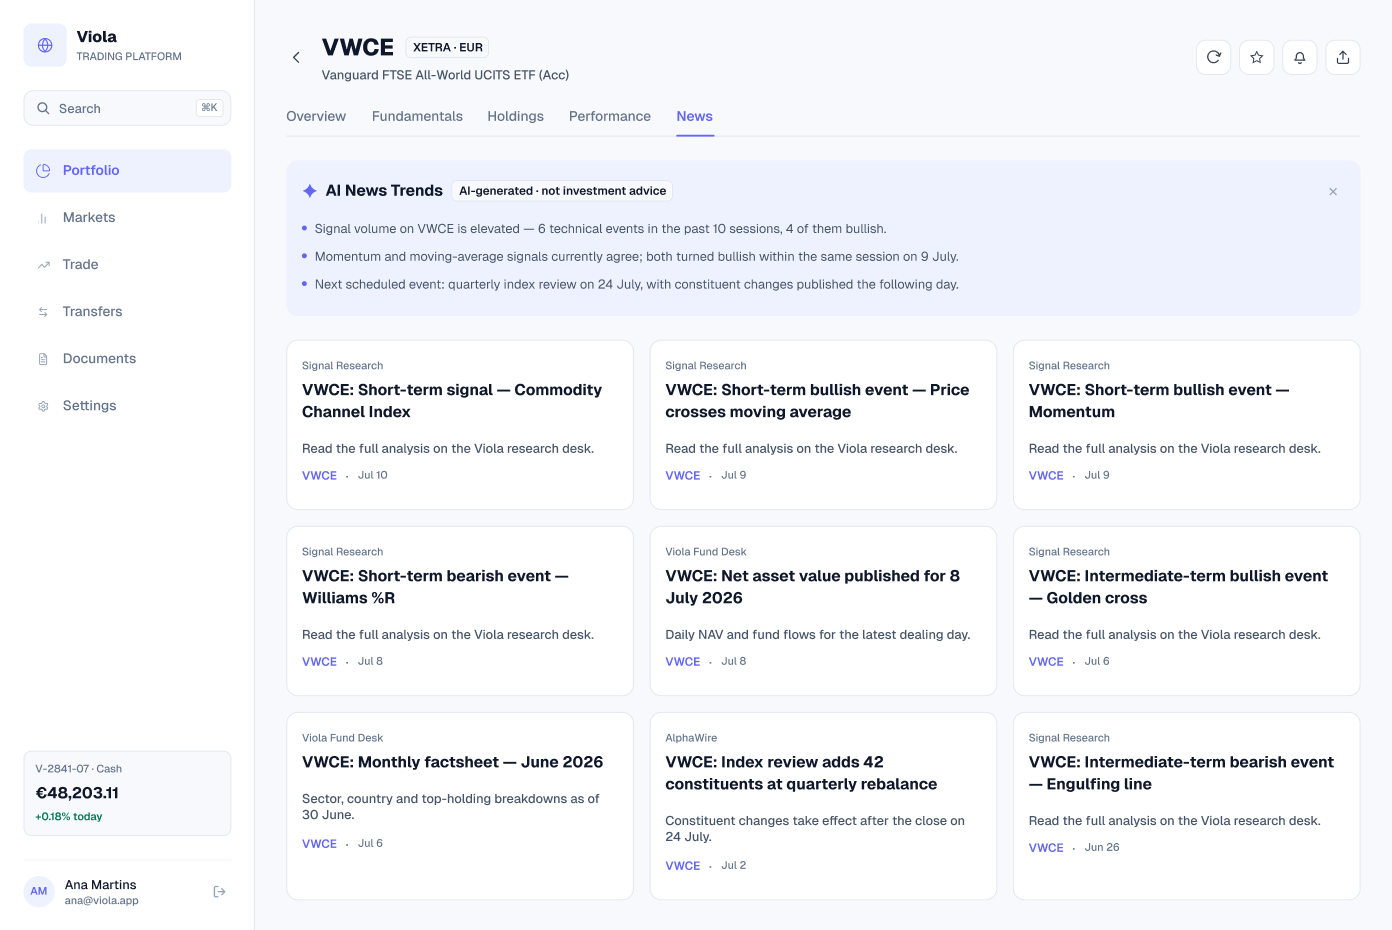
AI News Trends sums up the signals on VWCE. It’s labelled AI-generated and not investment advice. Below it, a feed from Signal Research, the Viola Fund Desk and AlphaWire: technical events, the daily NAV, the June factsheet and a quarterly index review.
Screens at a glance
| Screen | What it shows | Built from |
|---|---|---|
| Overview | Quote, price chart, position and fund facts | sidebar, tab-bar, range-tabs, tag, table/cell |
| Fundamentals | Objective, returns, ratings, risk and ratios | sidebar, tab-bar, tag, table/cell |
| Holdings | Top 10 and allocation by industry, region, country, currency | sidebar, tab-bar, tag, table/cell |
| Performance | Price chart, returns and risk analysis | sidebar, tab-bar, button-group, table/cell |
| News | AI news summary and a news feed | sidebar, tab-bar, ai-market-brief, button |
Data that agrees
VWCE is the customer’s largest holding, so the fund page and the portfolio have to agree. Each figure in the position card can be worked out from the others, and it appears unchanged on the screens listed.
| Figure | How it’s worked out | Value | Also on |
|---|---|---|---|
| Shares | Held in V-2841-07 | 131.7 | Portfolio, Trade |
| Cost basis | 131.7 × €148.02 | €19,494.23 | Trade |
| Market value | 131.7 × €166.50 | €21,928.05 | Portfolio, Dashboards |
| Unrealised P&L | €21,928.05 − €19,494.23 | +€2,433.82 | Portfolio, Trade |
| Weight | €21,928.05 ÷ €48,203.11 | 45.5% | Portfolio, AI copilot |
Built from
The five screens are built from Viola components, so a change in the library reaches every screen. Counts are for the light screens.
| Component | Instances | Used on | What it does |
|---|---|---|---|
| table/cell | 307 | Four of five | Quote, facts, holdings and return rows |
| button | 31 | All five | Buy, sell and document links |
| tag | 6 | All five | Status and category labels |
| sidebar | 5 | All five | App navigation and the account card |
| tab-bar | 5 | All five | Overview, Fundamentals, Holdings, Performance, News |
| button-group | 4 | Performance | Chart ranges and value switches |
| range-tabs | 1 | Overview | Chart ranges |
| ai-market-brief | 1 | News | AI News Trends |
Get the file
The Fund page screens are in the full Viola UI kit, with 100+ screens in light and dark. Open the Figma preview to see them all, or get the kit for $49.