20 screens · light and dark
Markets
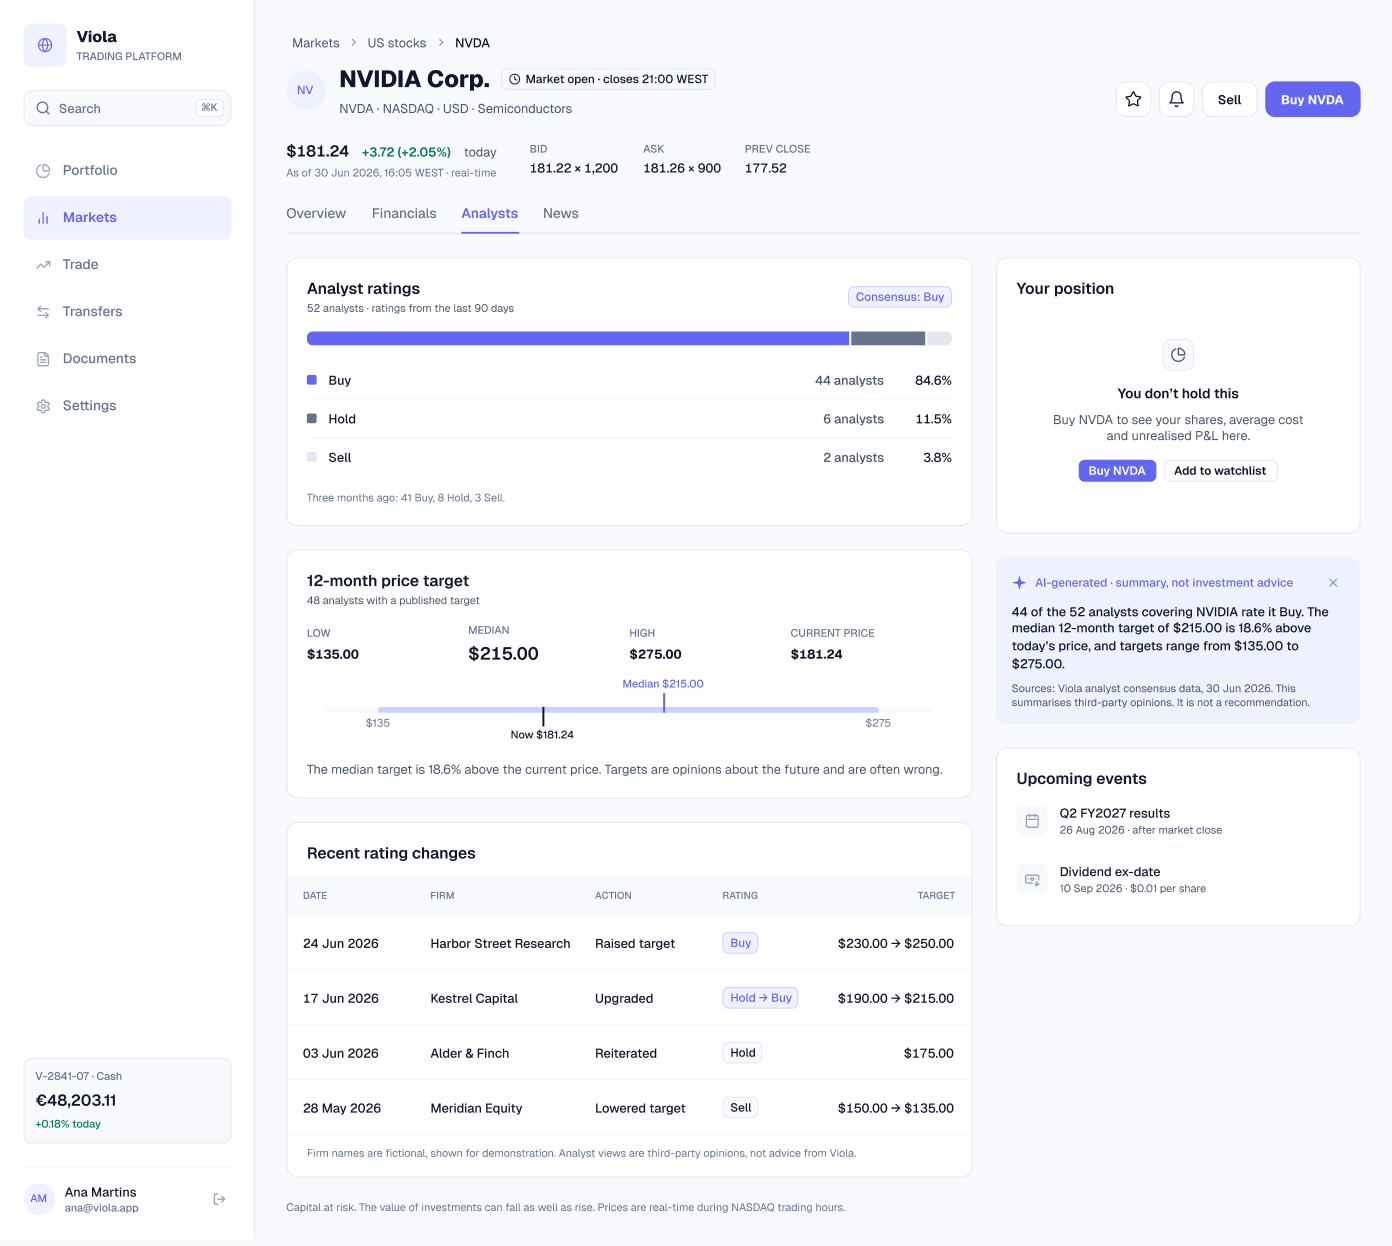
The markets section: an overview of indices and instruments, a stock page, a screener, global search, movers with a heatmap, watchlists and price alerts. Every screen uses the same four holdings and the same prices, so ASML is €840.39 and 6.2 shares wherever it appears.
Markets
Four index tiles, the S&P 500, Nasdaq 100, Euro Stoxx 50 and FTSE 100, each with a sparkline, sit above a watchlist with tabs for US, Asia and Europe stocks and ETFs, and exchange and sector filters. The table shows a chart, price, change, volume and market cap for each instrument, 10 rows at a time out of 61.
AI News Trends closes the screen. It’s labelled AI-generated and not investment advice, and it summarises technical signals rather than recommending trades.
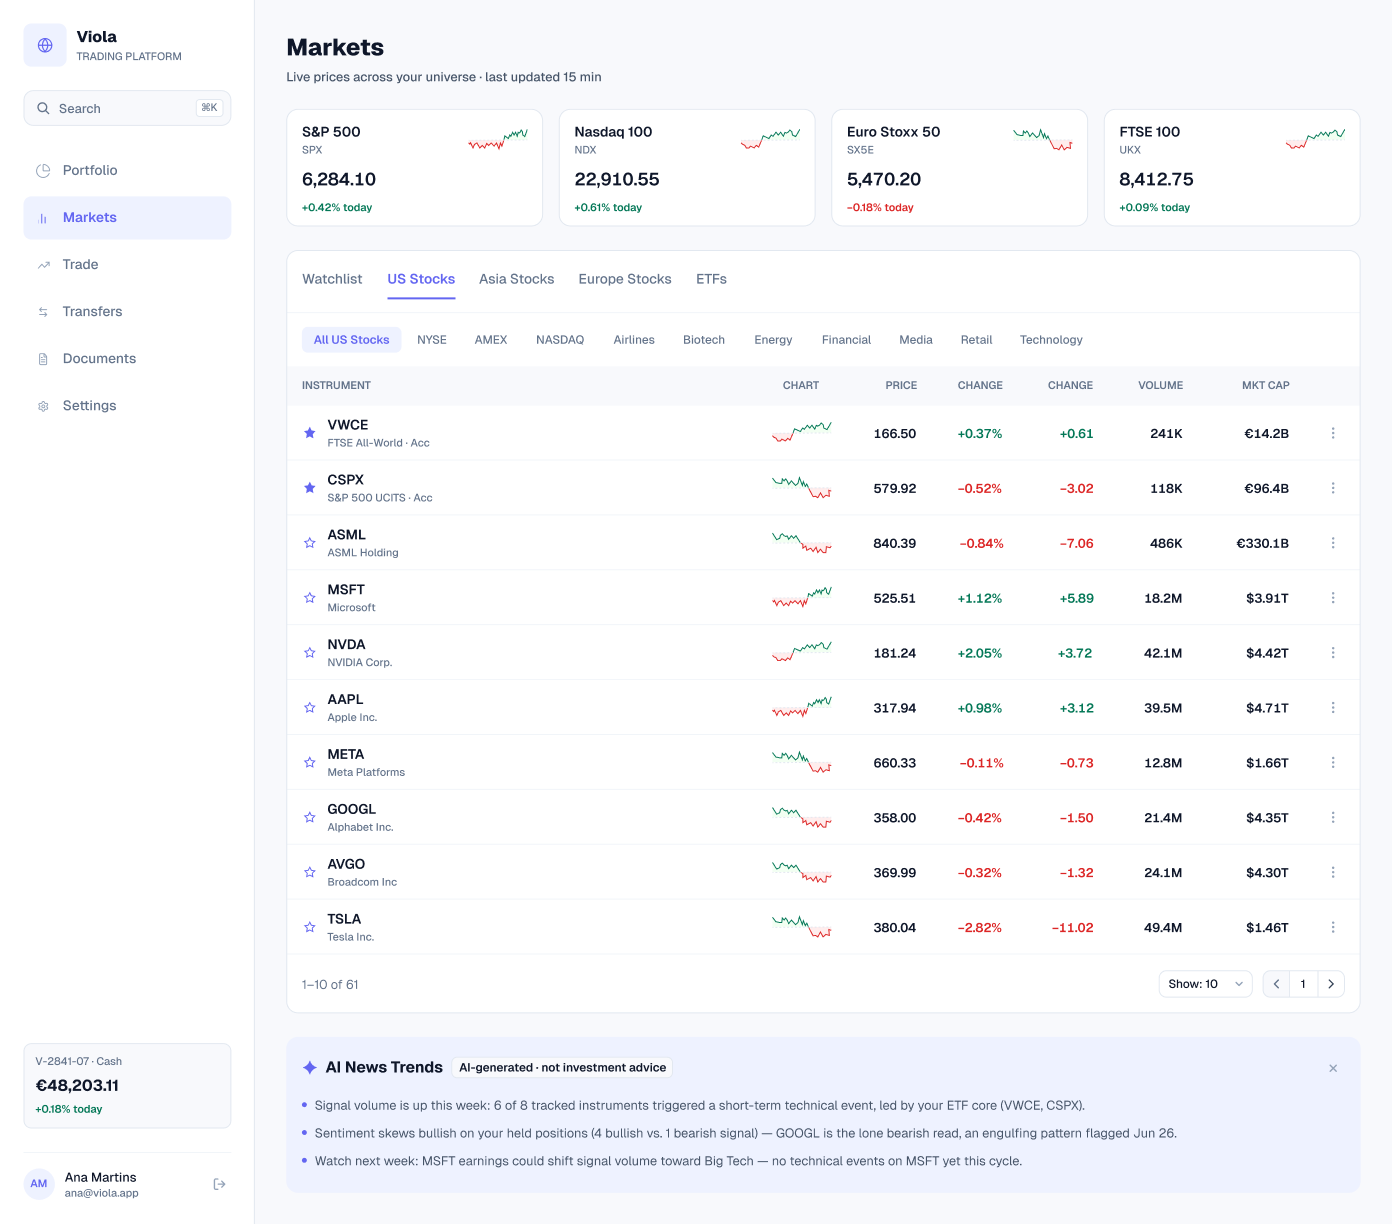
Stock detail, ASML
A single-equity page, the counterpart to the VWCE fund page. The quote header carries the last price, day change, market status, bid and ask, Buy and Sell, and the watchlist and alert icons. The chart switches between line and candles, with volume, your €890.81 average cost as a dashed line, and markers for earnings and dividends.
Your position shows 6.2 shares worth €5,210.44, €312.60 below cost. Key statistics, an About card and a labelled AI summary with its sources complete the overview.
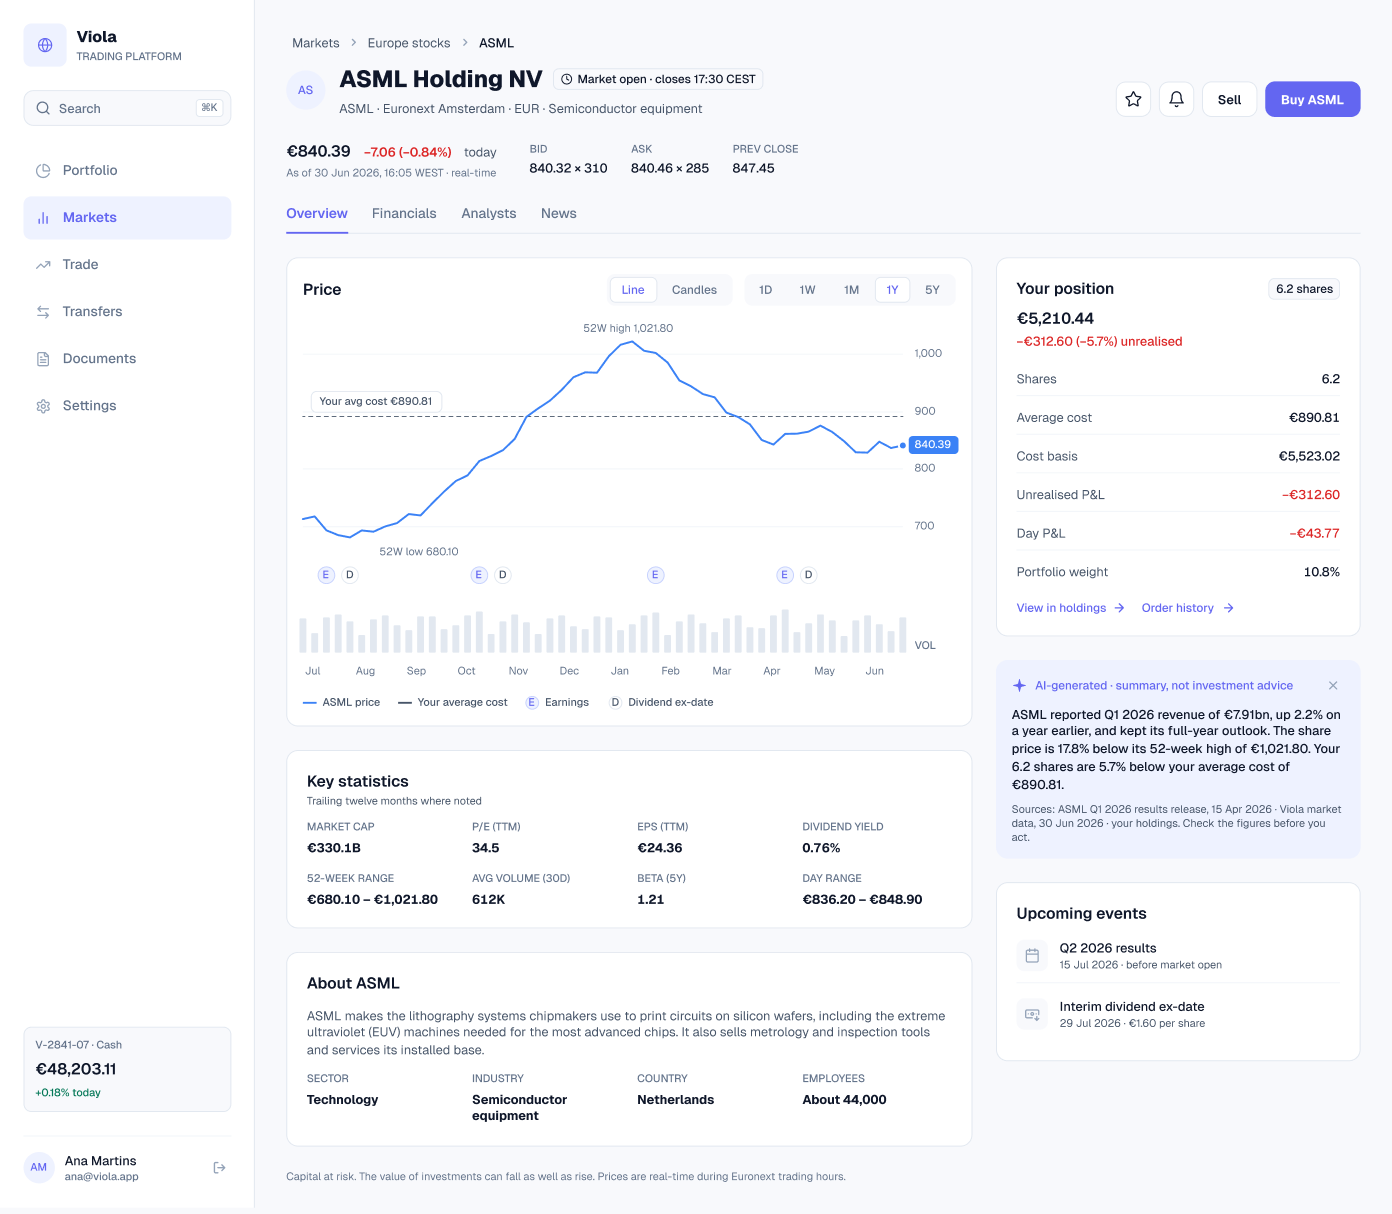
Stock detail, financials
Quarterly revenue and net income as bars, the reported results in a table, and key ratios on the same grid as Key statistics. EPS of €24.36 over the last four quarters gives the P/E of 34.5 shown on the overview.
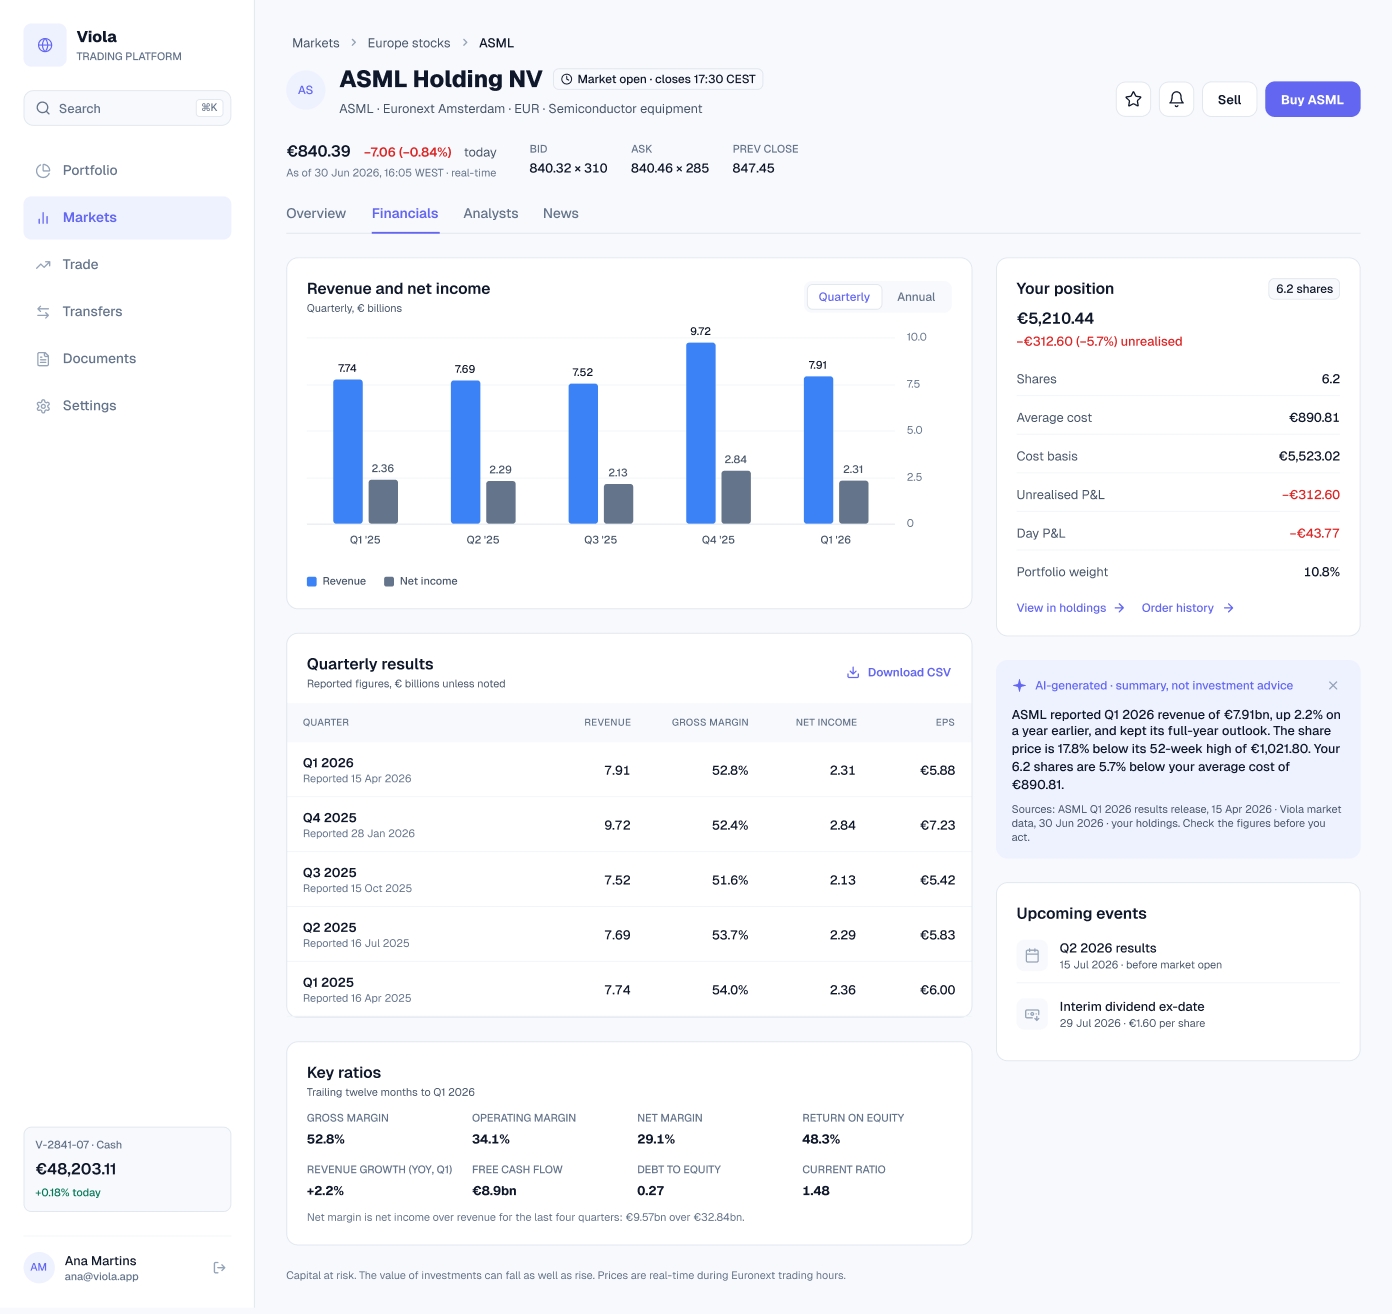
Stock detail, analysts
The analysts tab for NVIDIA, a stock the customer doesn’t hold, so the position card shows its empty state. The rating split, the 12-month price target range against today’s price, and recent rating changes. Firm names are fictional.
Screener
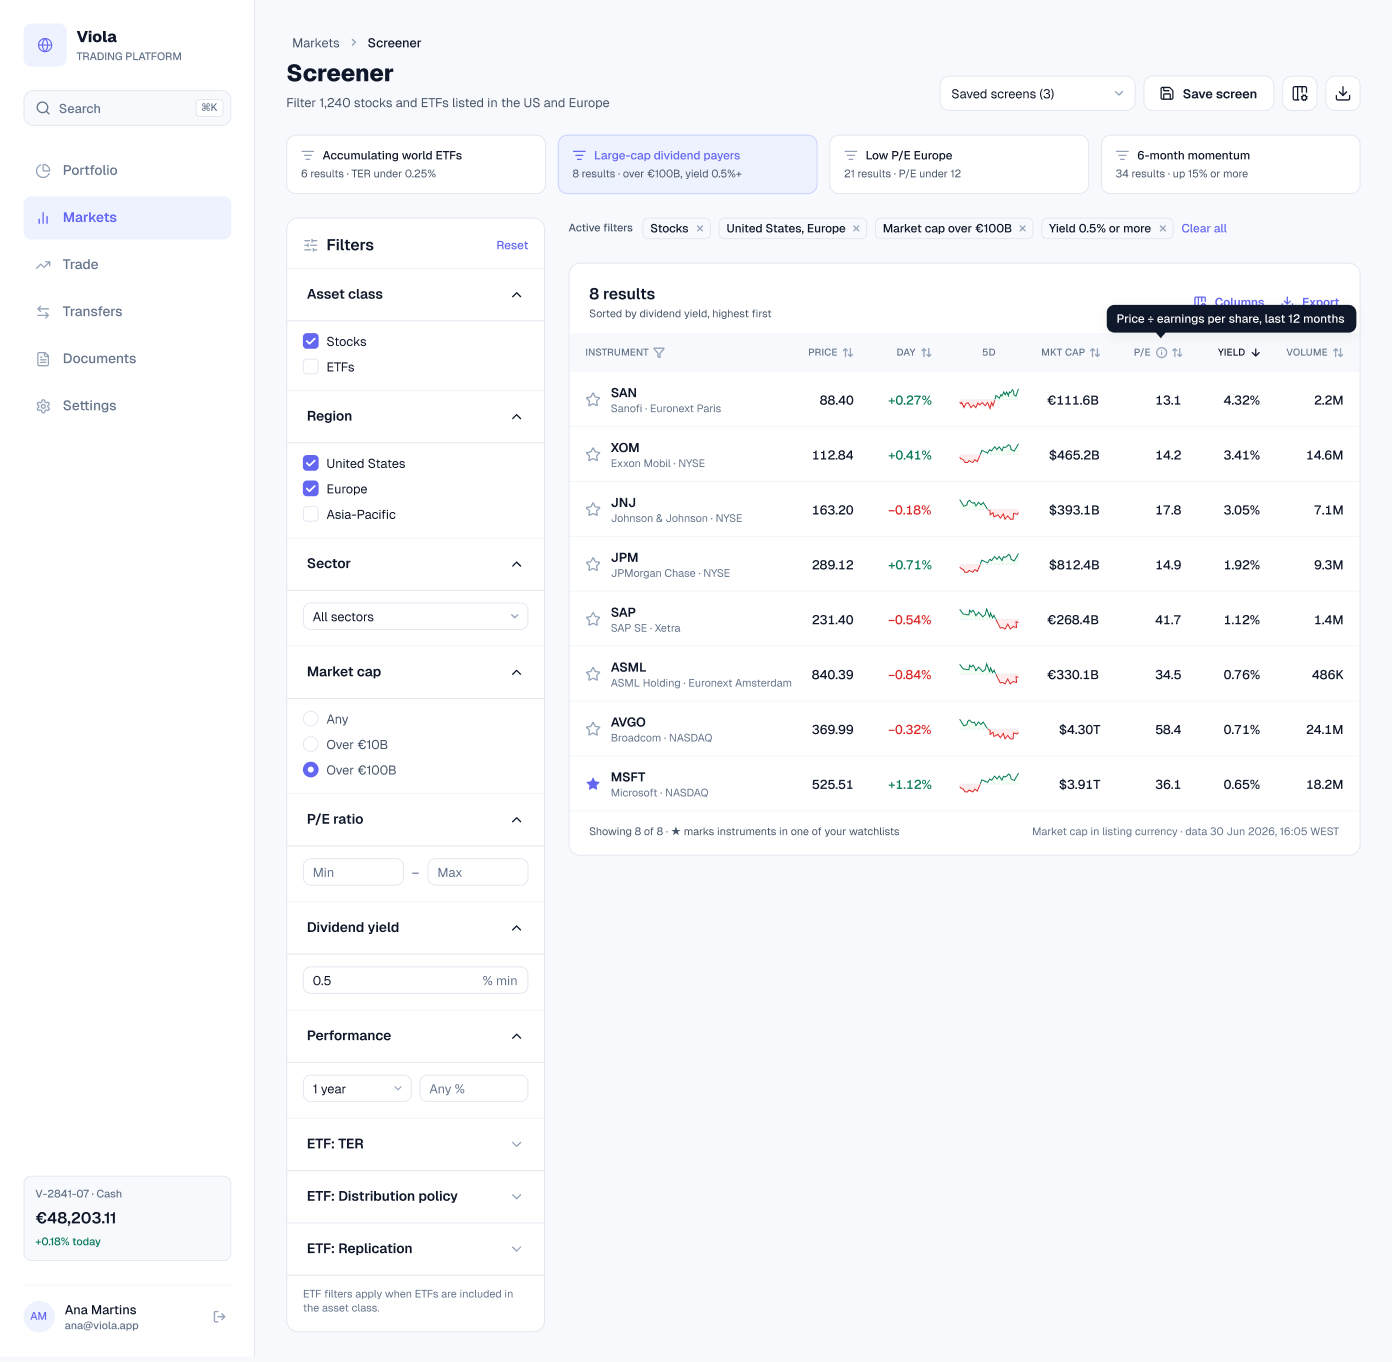
A filter panel for asset class, region, sector, market cap, P/E, dividend yield and performance, with ETF filters for TER, distribution and replication. Presets, removable filter chips, and sortable results with a watchlist star on each row.
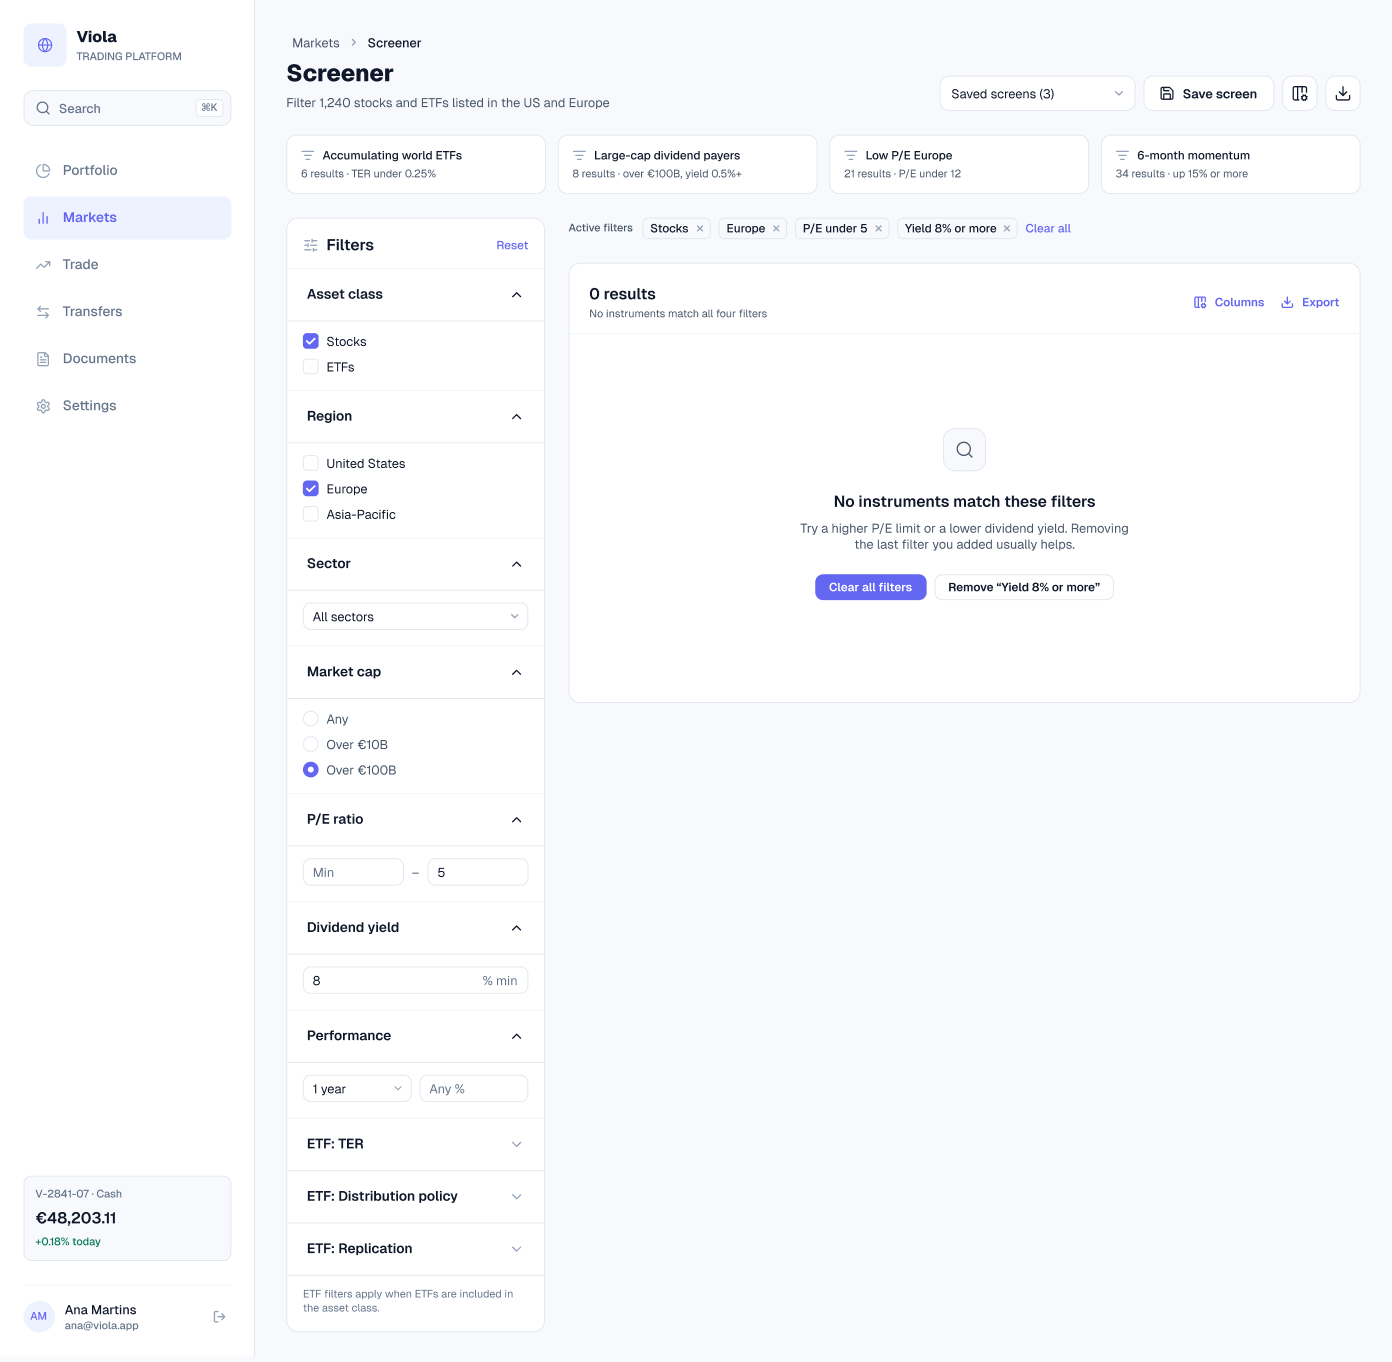
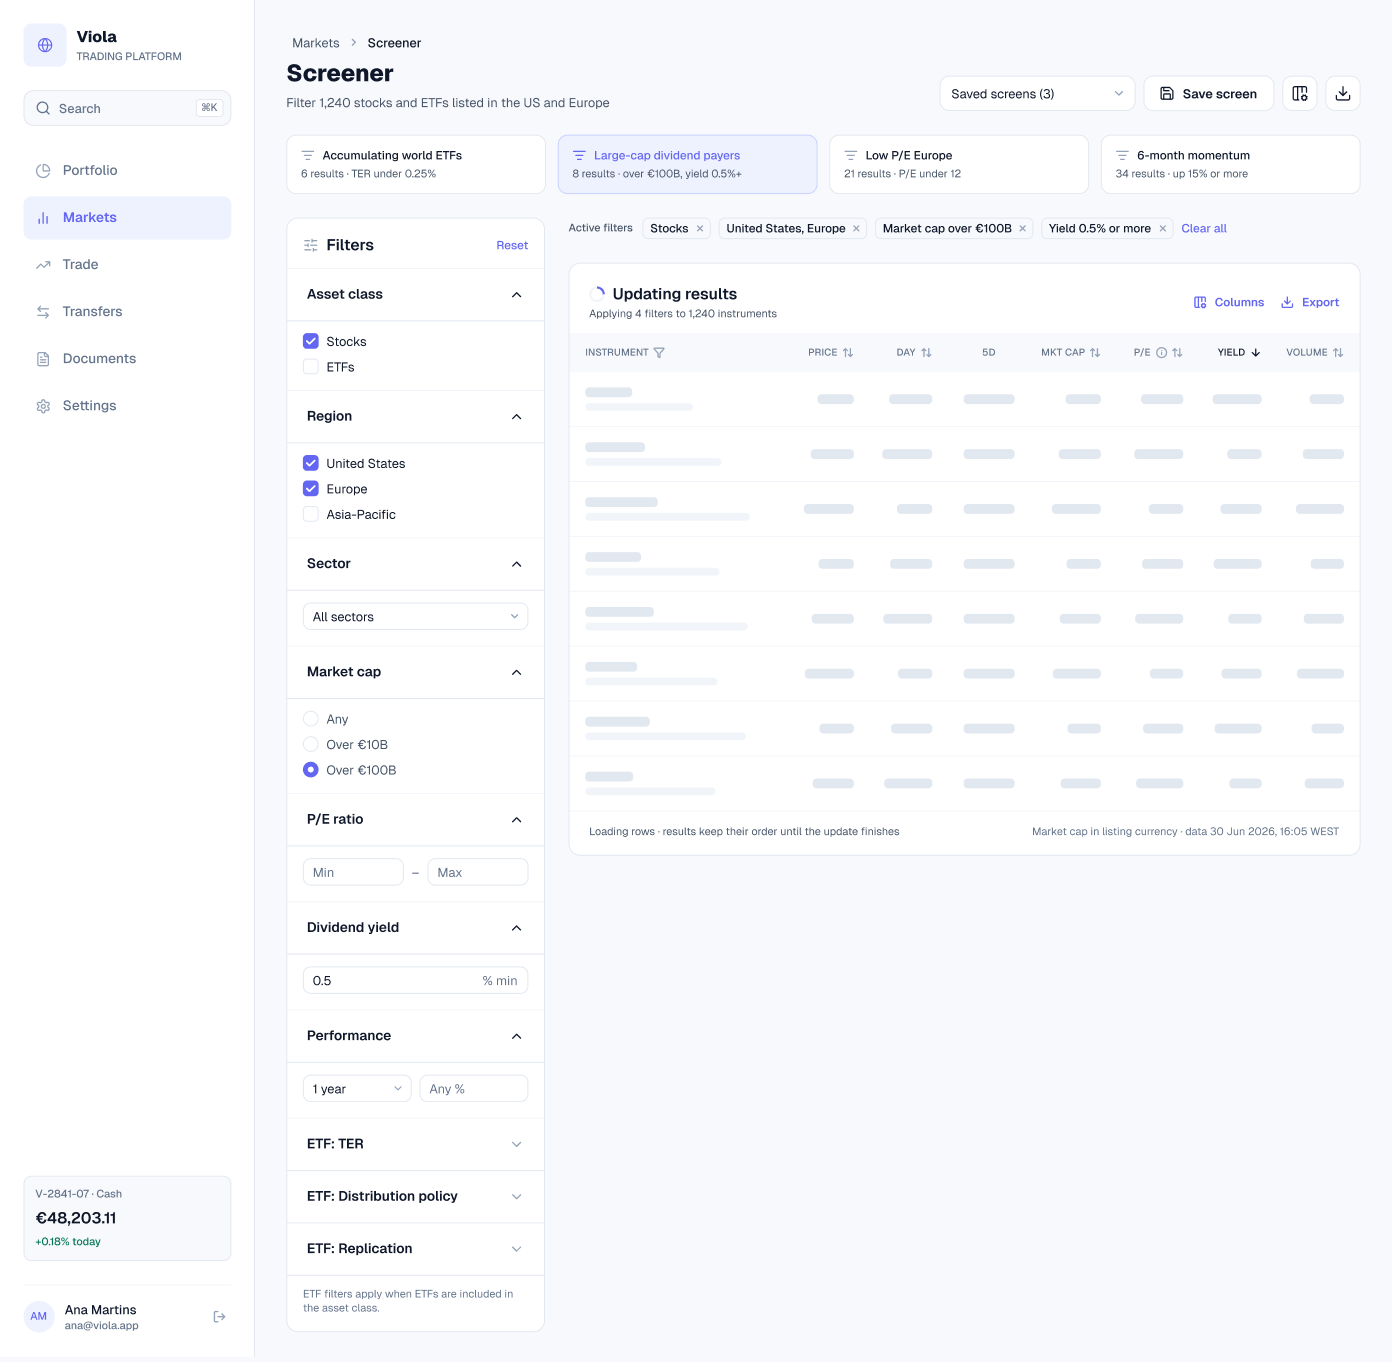
Screener, no results and loading
When the filters rule everything out, the results card uses the no-results empty state with a way back. While results update, rows load as placeholders in the same columns.
Search
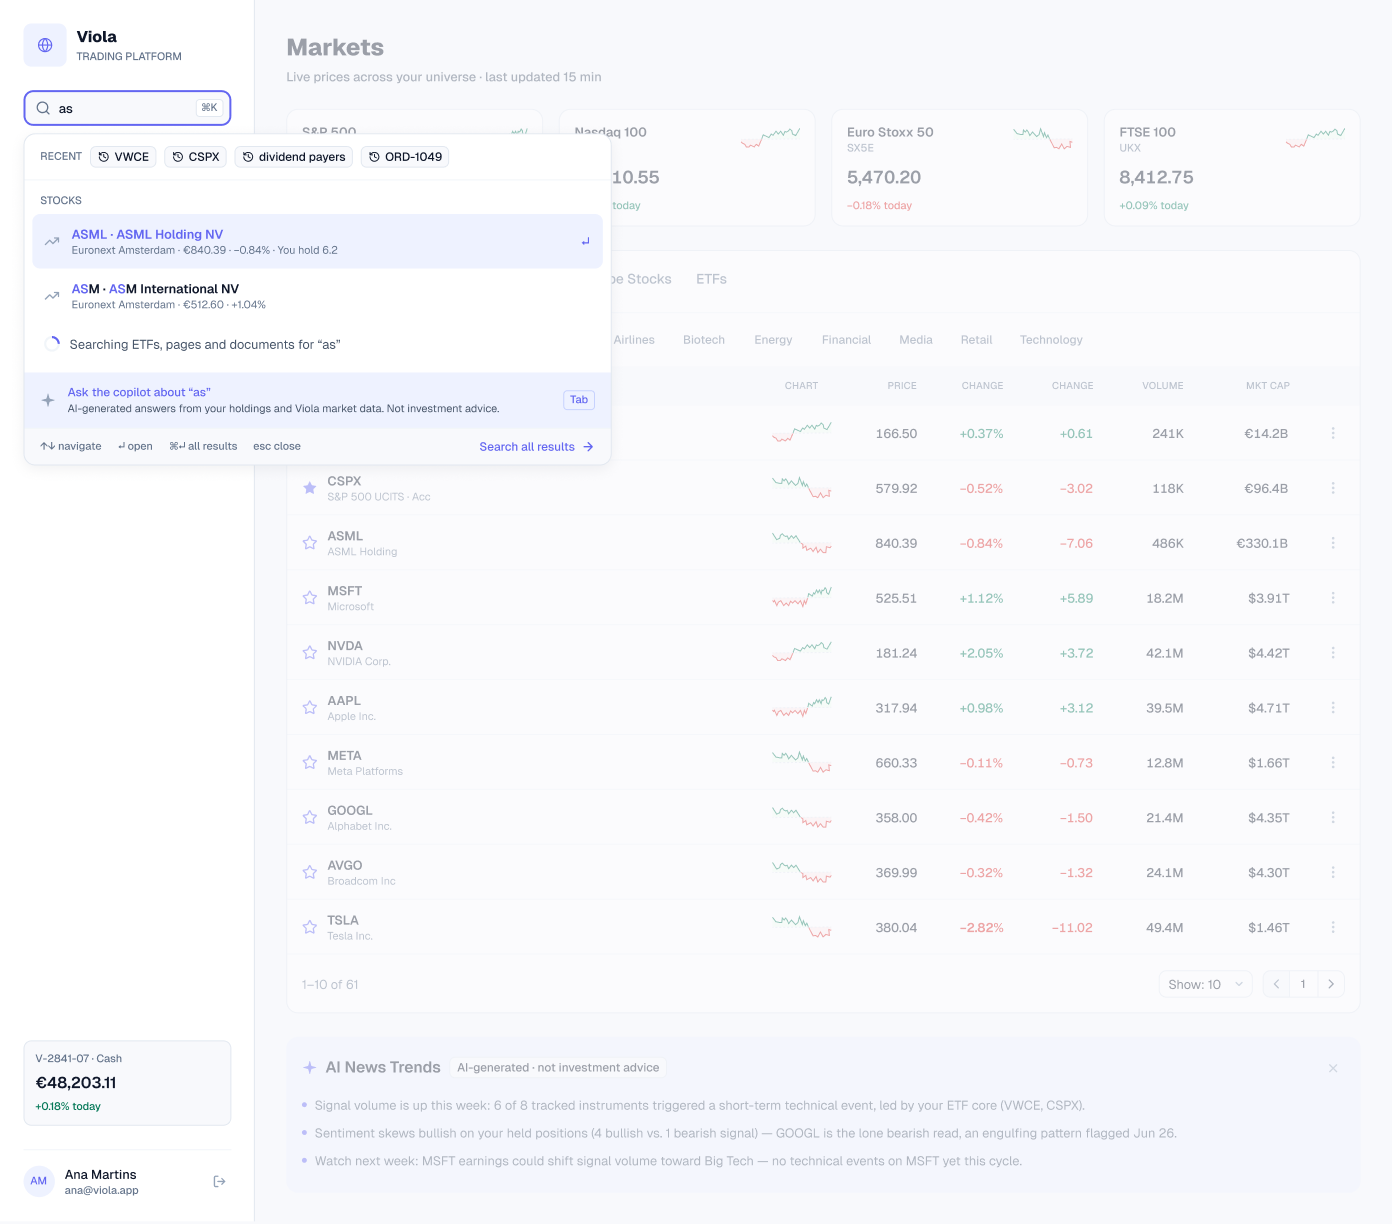
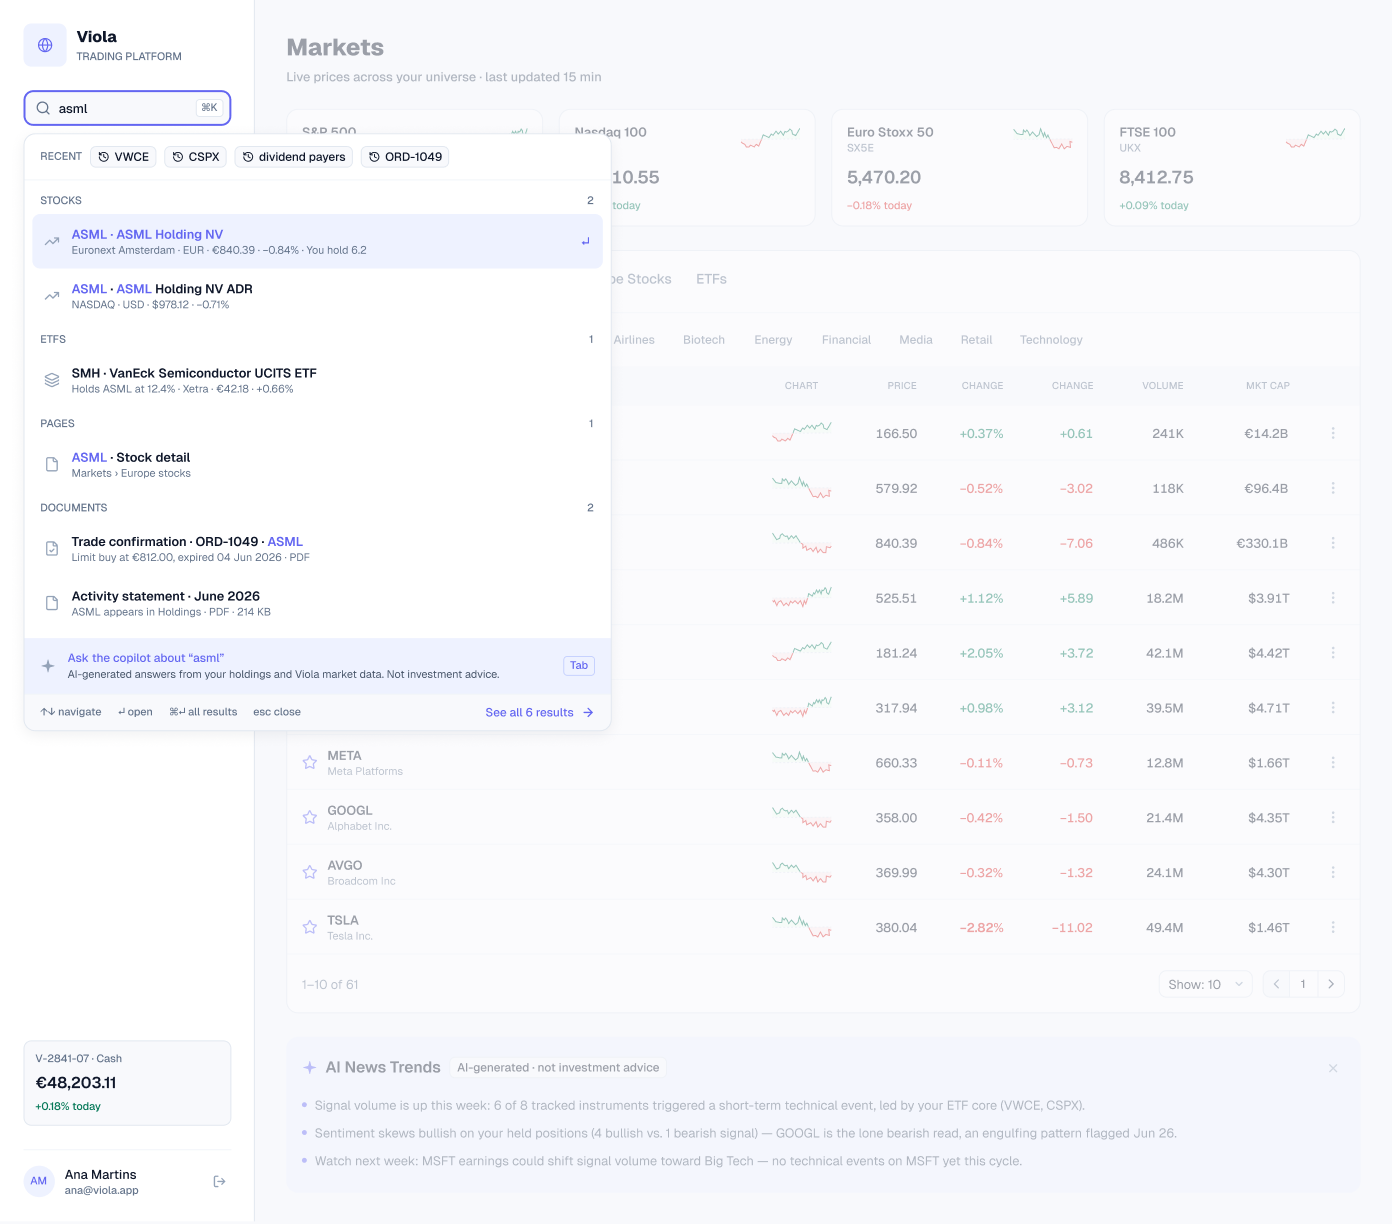
Global search as a dropdown from the sidebar: recent searches first, then results grouped into stocks, ETFs, pages and documents, with the matched text highlighted, keyboard hints and an Ask the copilot row.
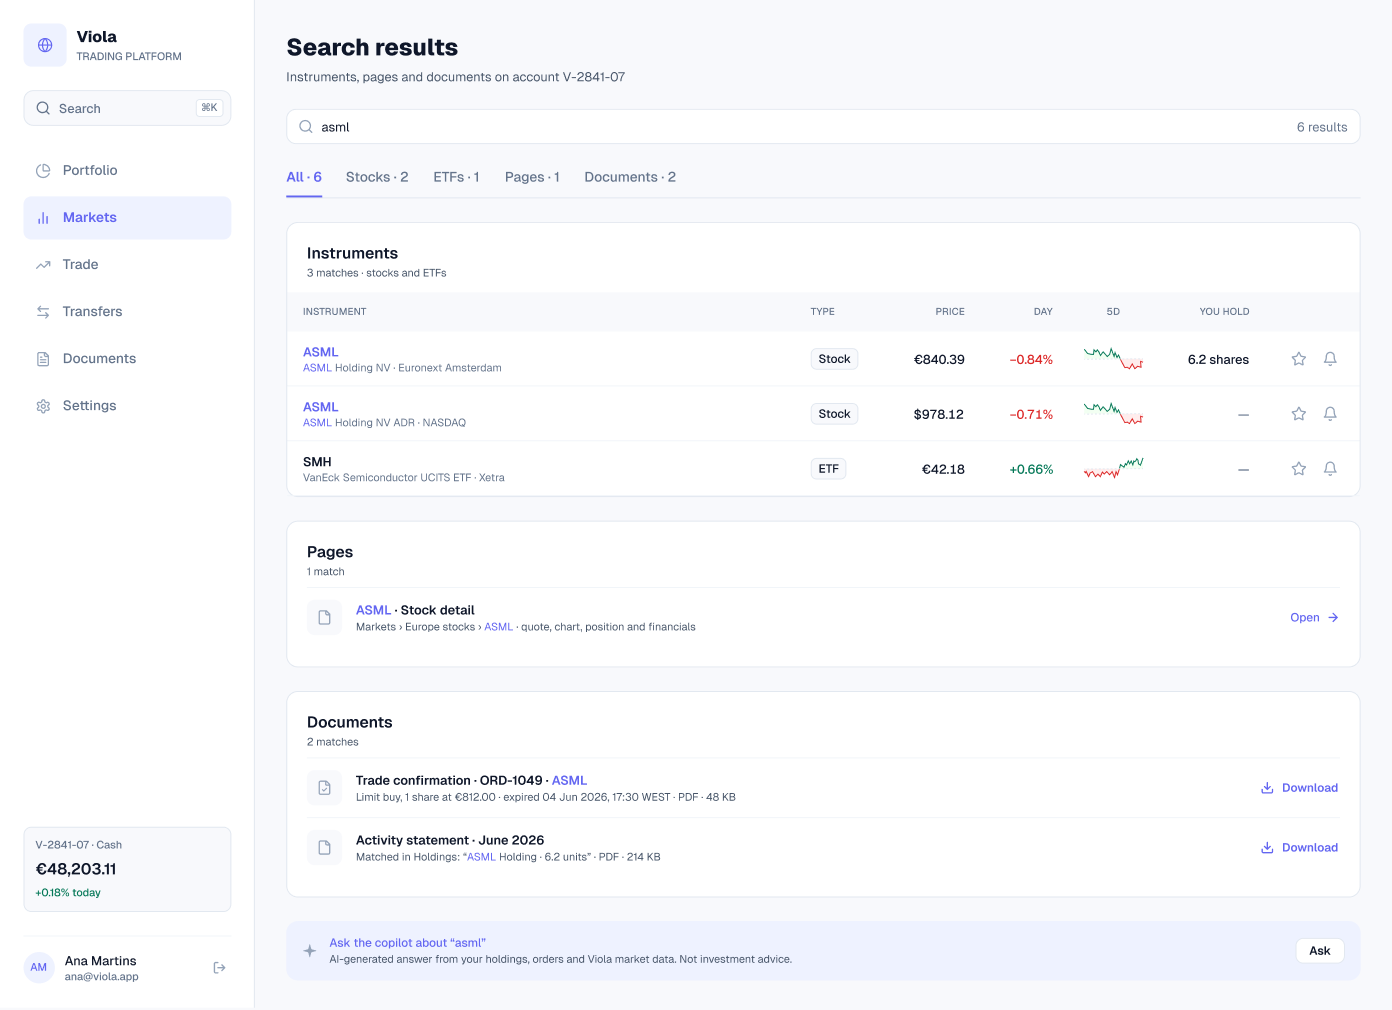
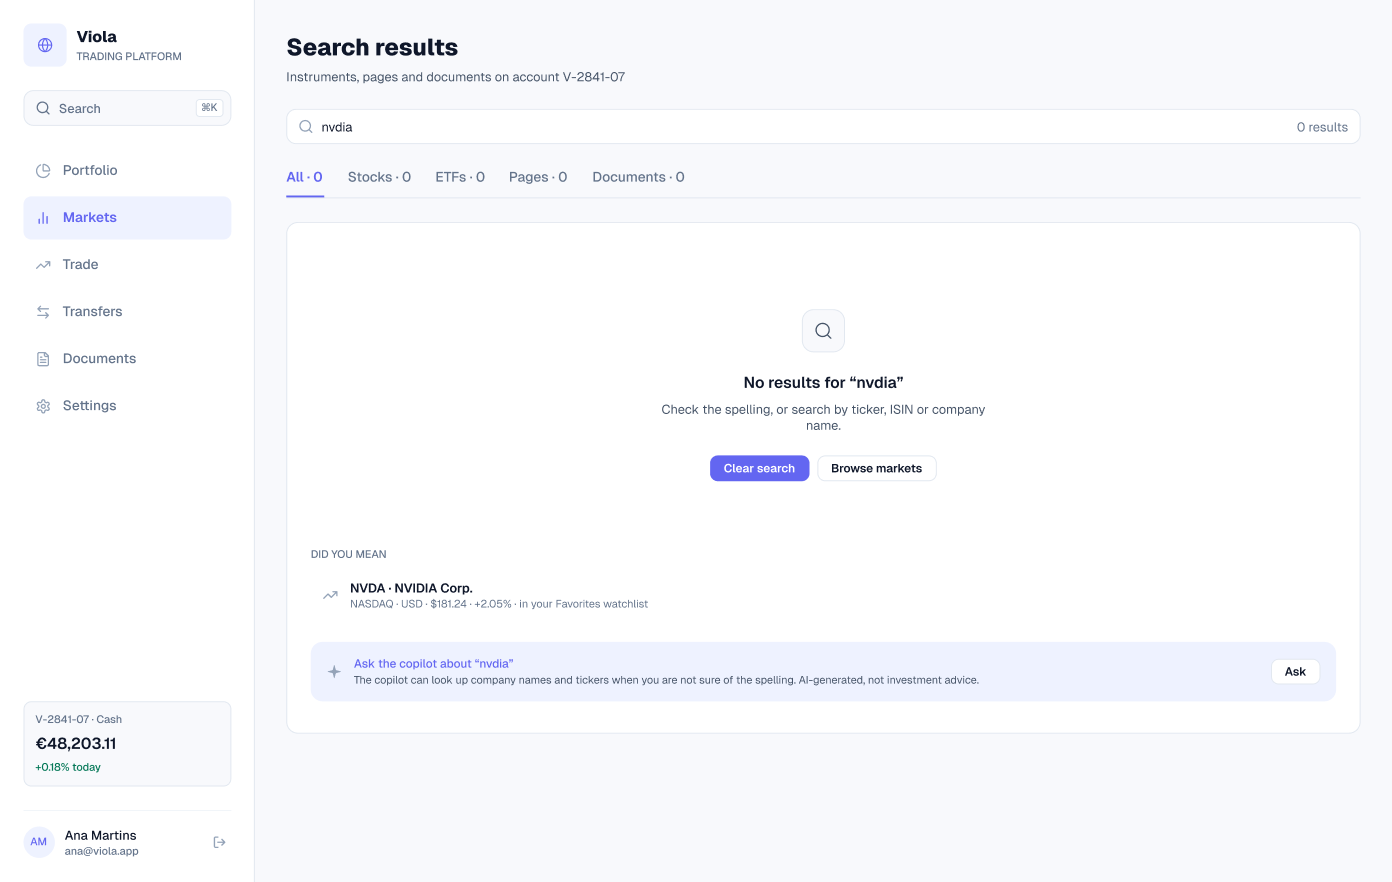
Search results and no results
The full page uses the same groups as tabs, a table for instruments and a list for pages and documents. With no match, the page suggests the closest instrument and offers the copilot.
Movers and heatmap
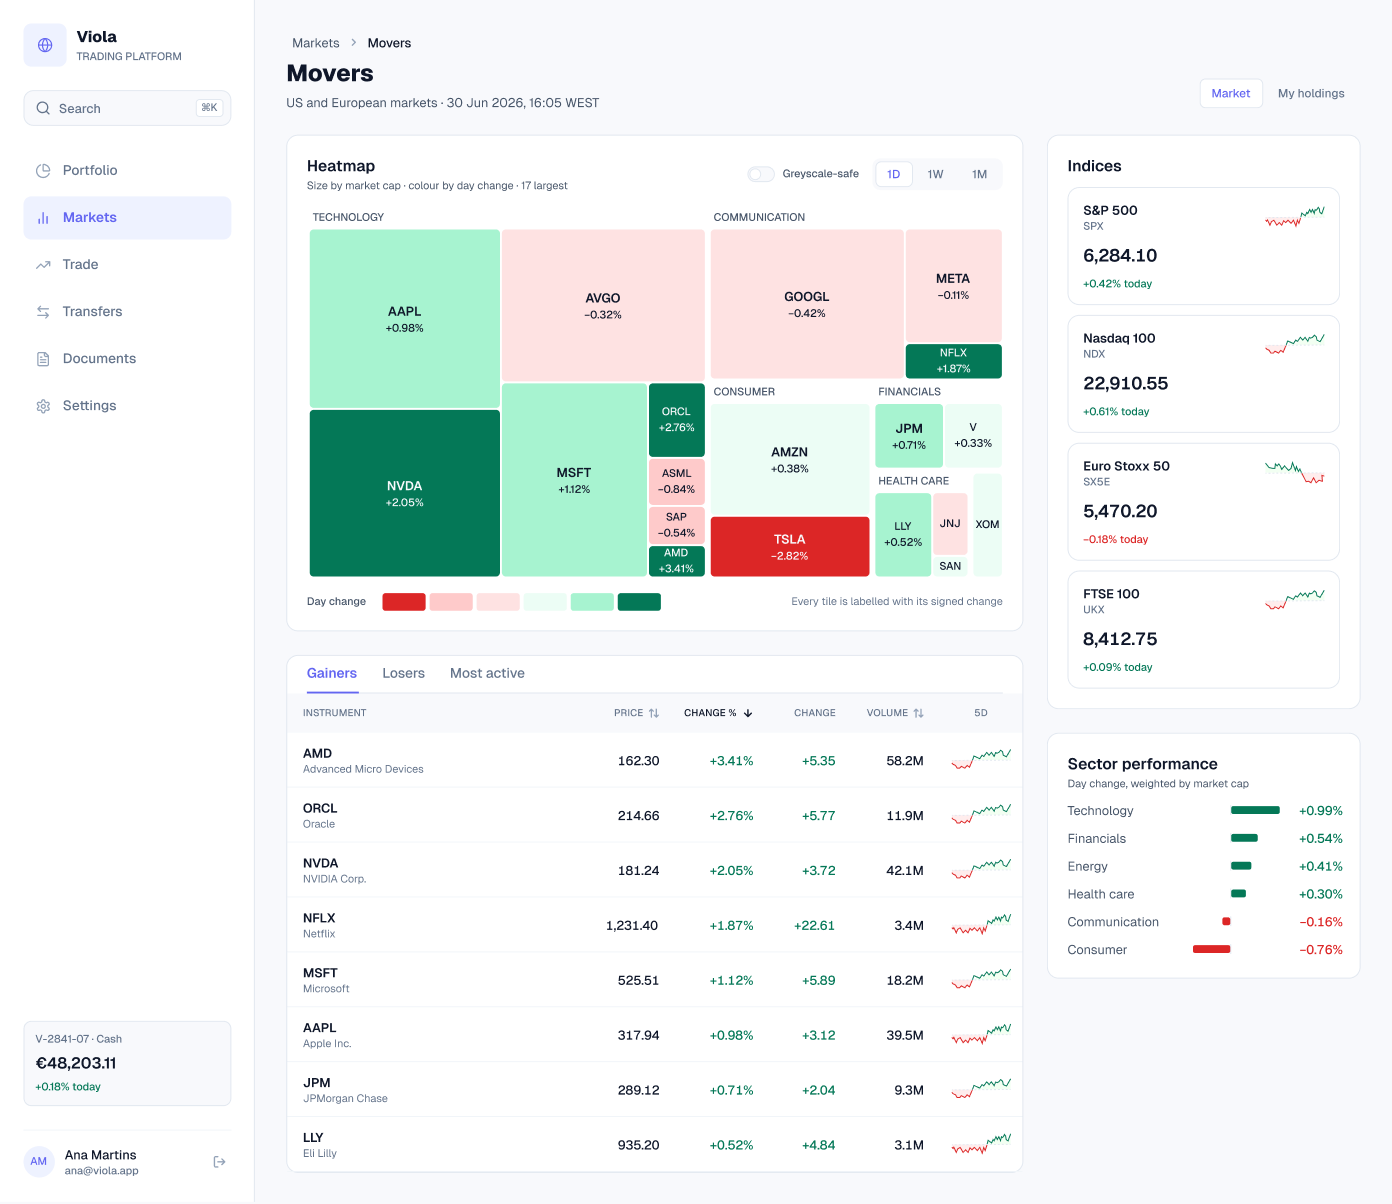
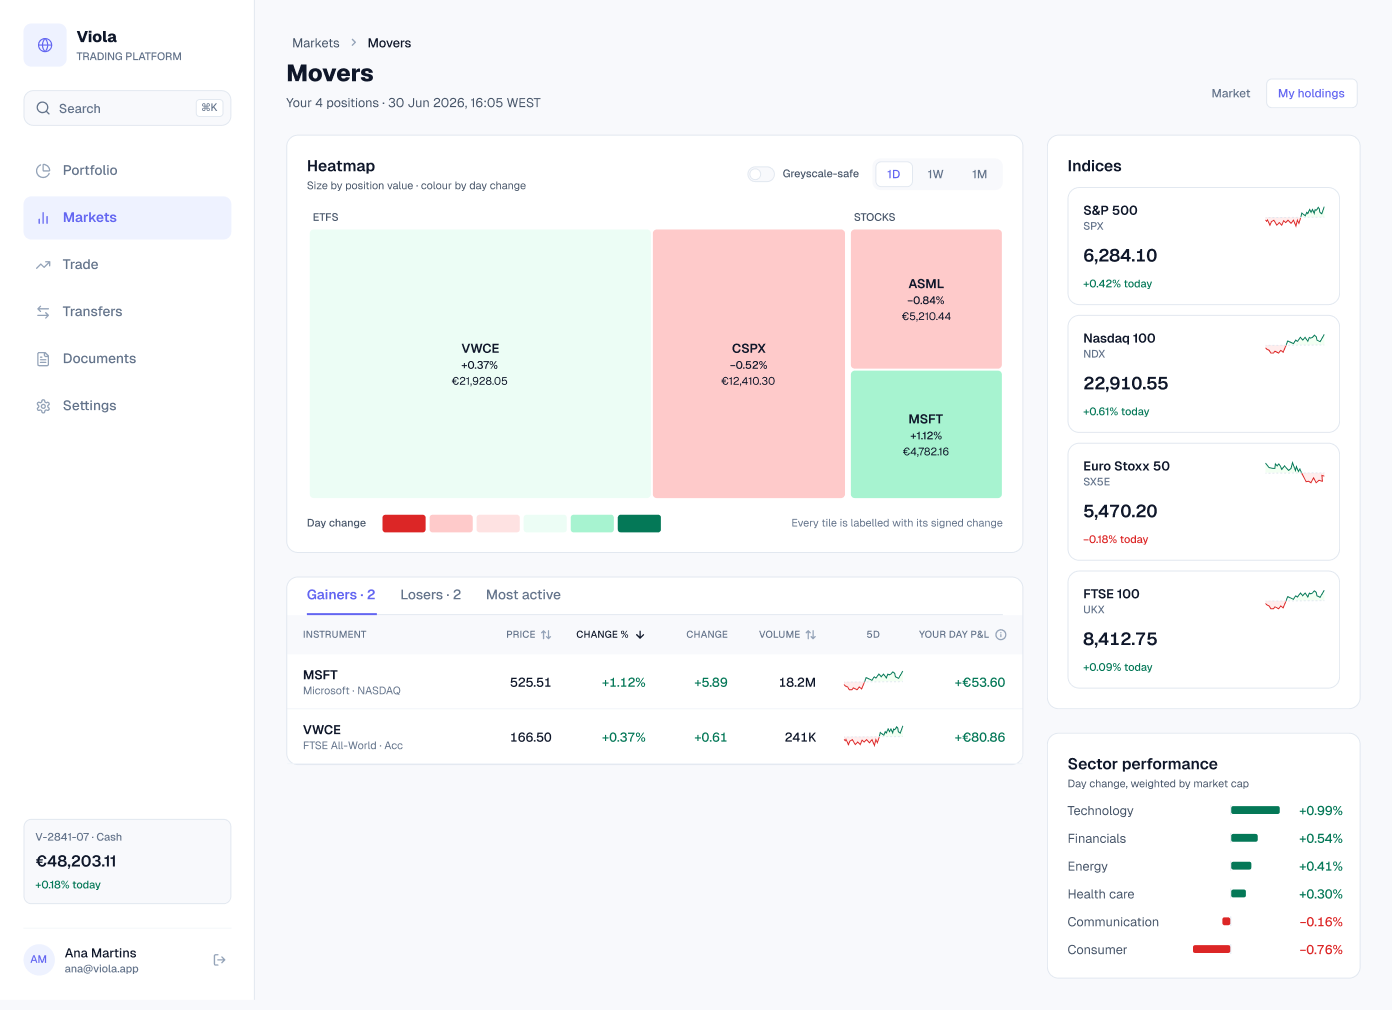
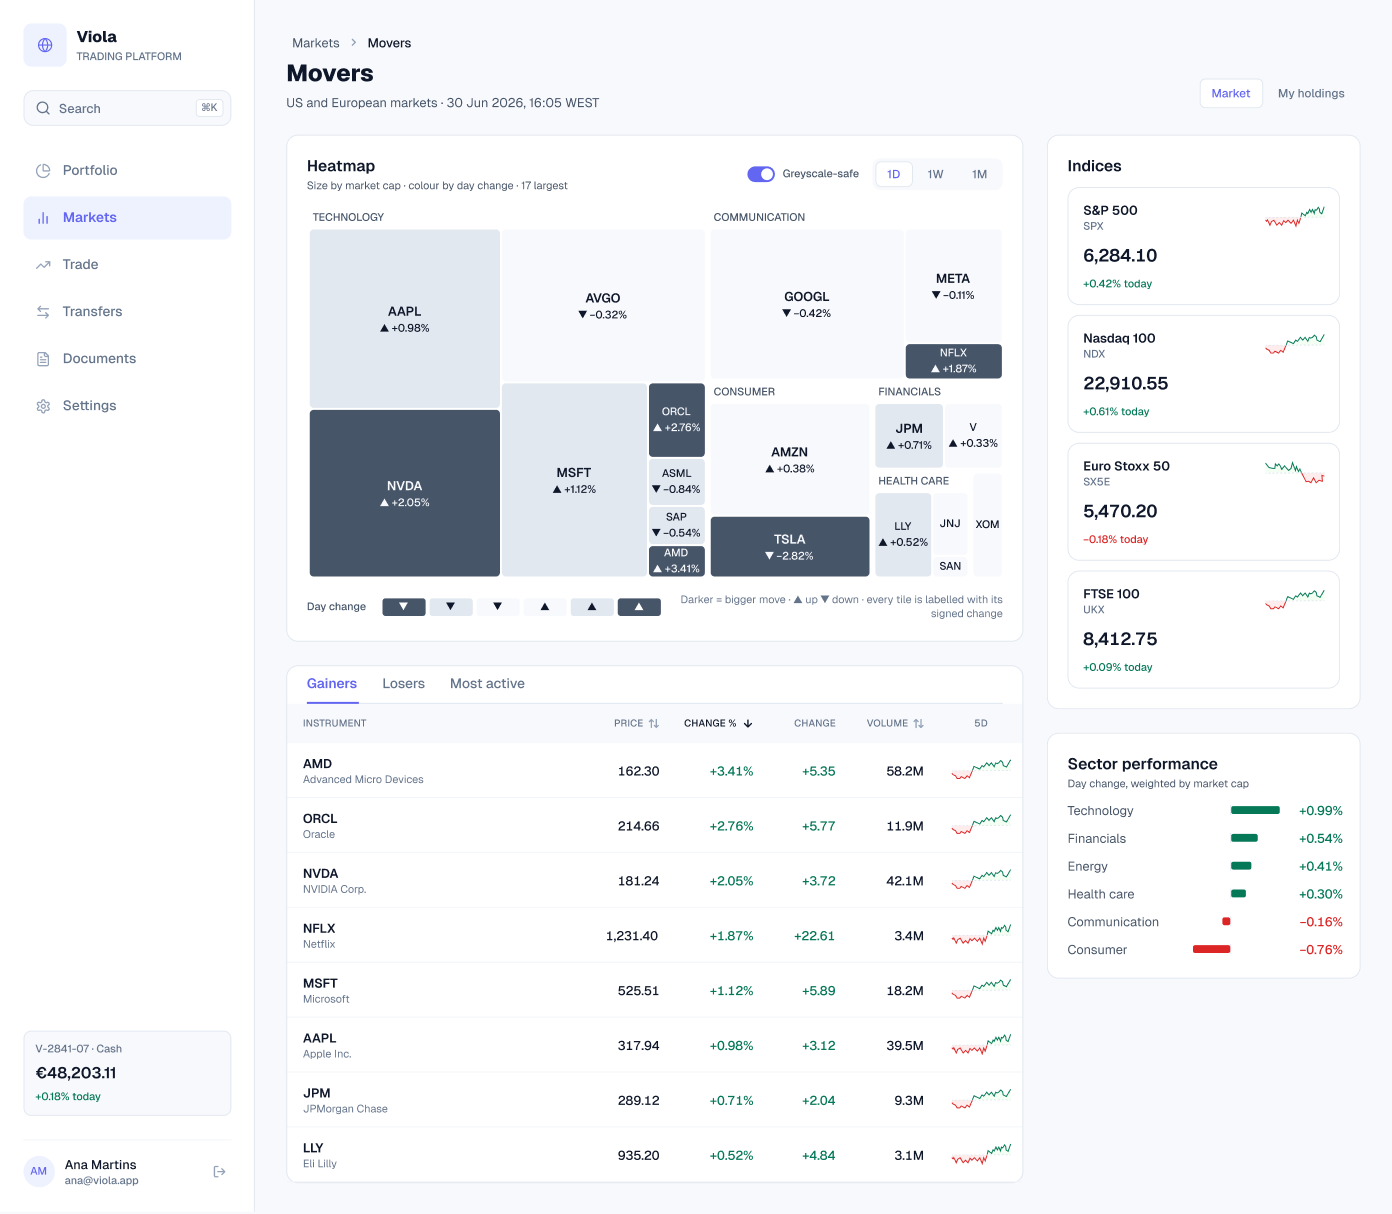
Gainers, losers and most active, with a heatmap sized by market cap and coloured by day change, grouped by sector. Index tiles and sector performance sit beside it.
Movers, my holdings and greyscale-safe
Switch the scope to My holdings and the heatmap shows the customer’s four positions, sized by value. The greyscale-safe version swaps colour for shades and ▲ ▼, and every tile keeps its signed label.
Watchlists
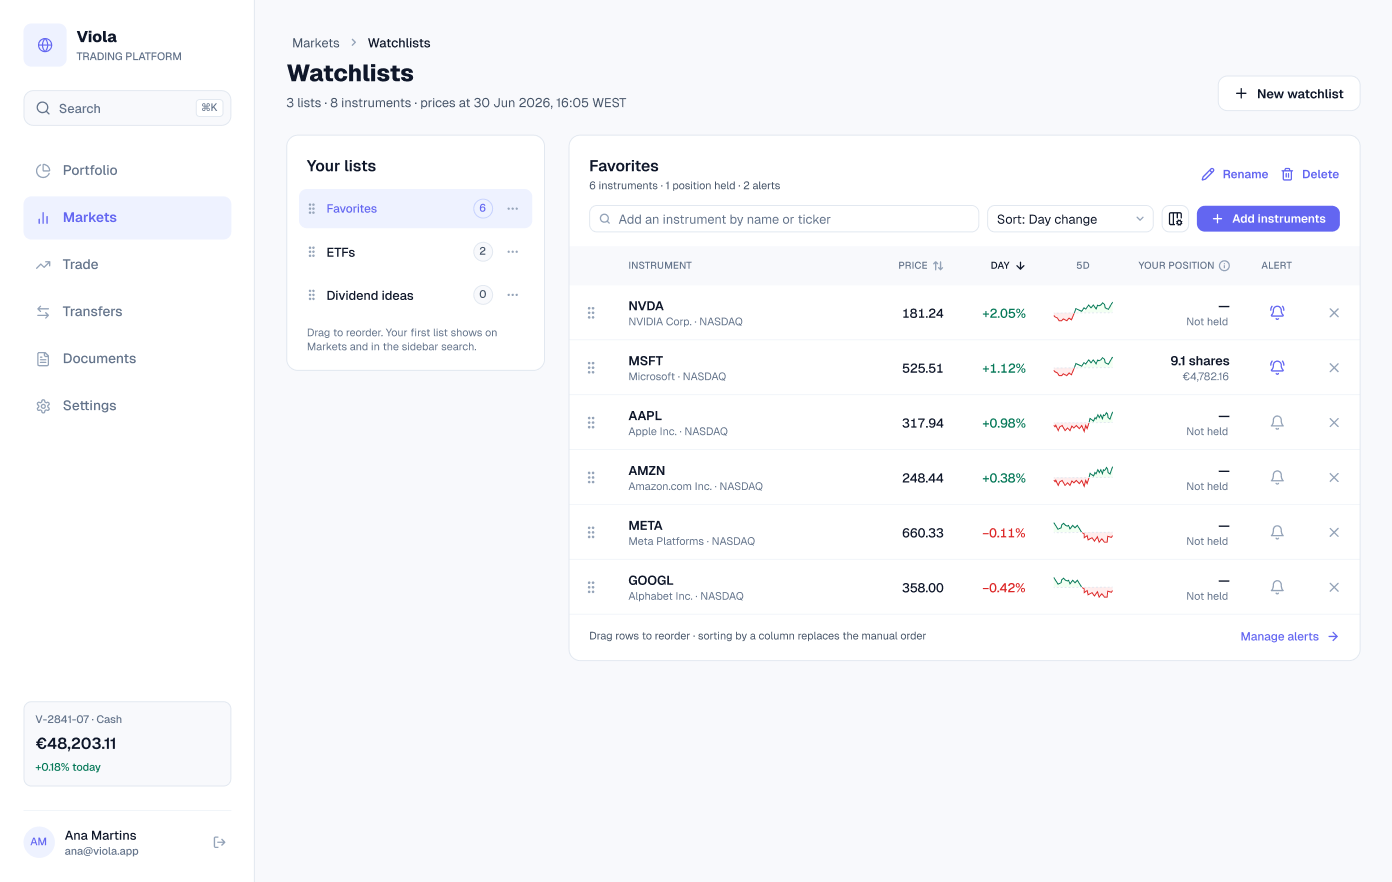
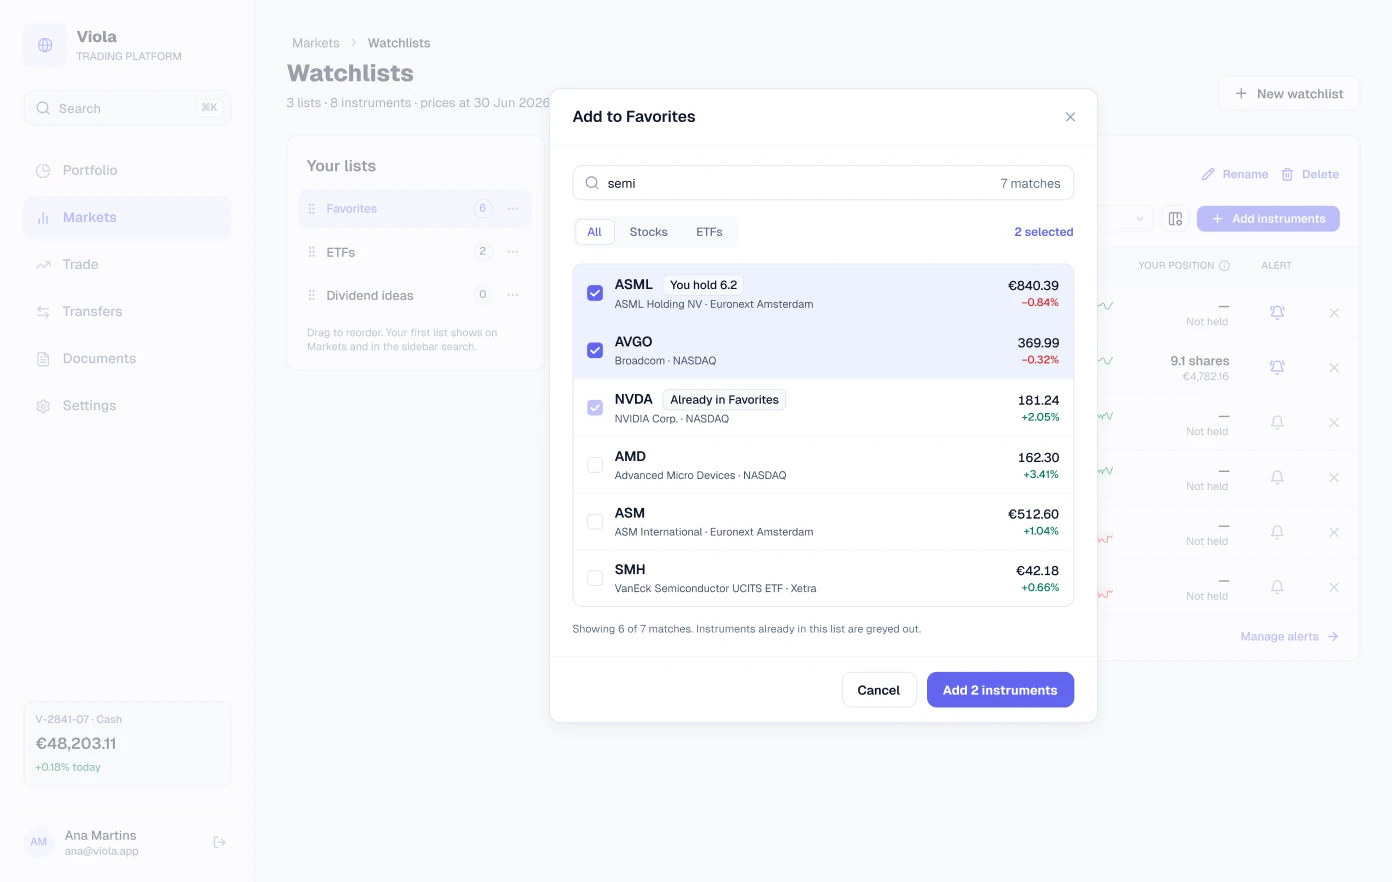
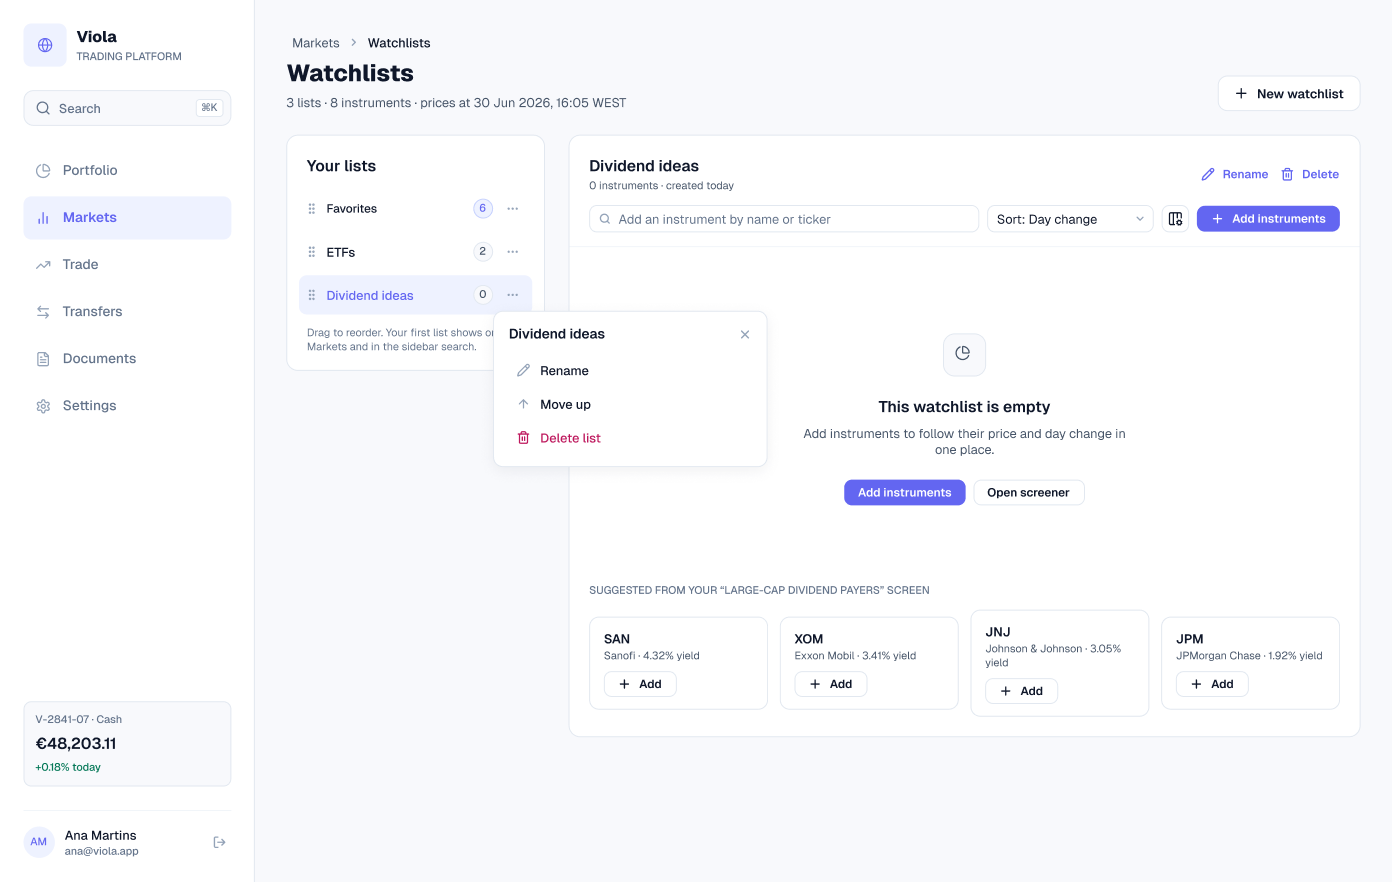
Several lists, each with a count, reorder, rename and delete. The table shows price, day change, a sparkline, your position and an alert bell on each row. Instruments are added from a search with multi-select, and a new list starts with suggestions from a saved screen.
Price alerts
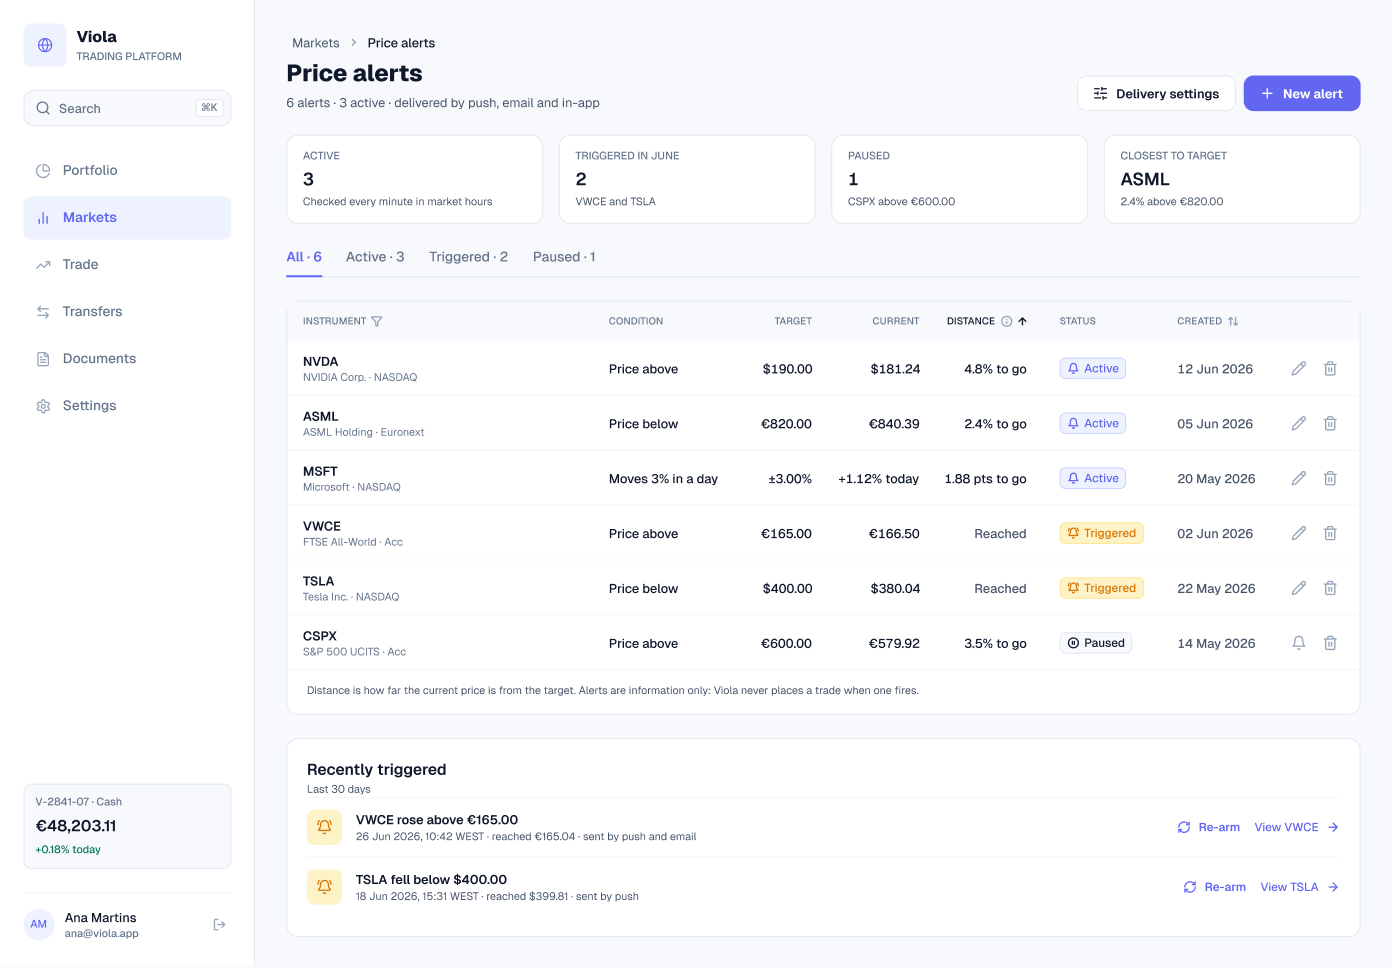
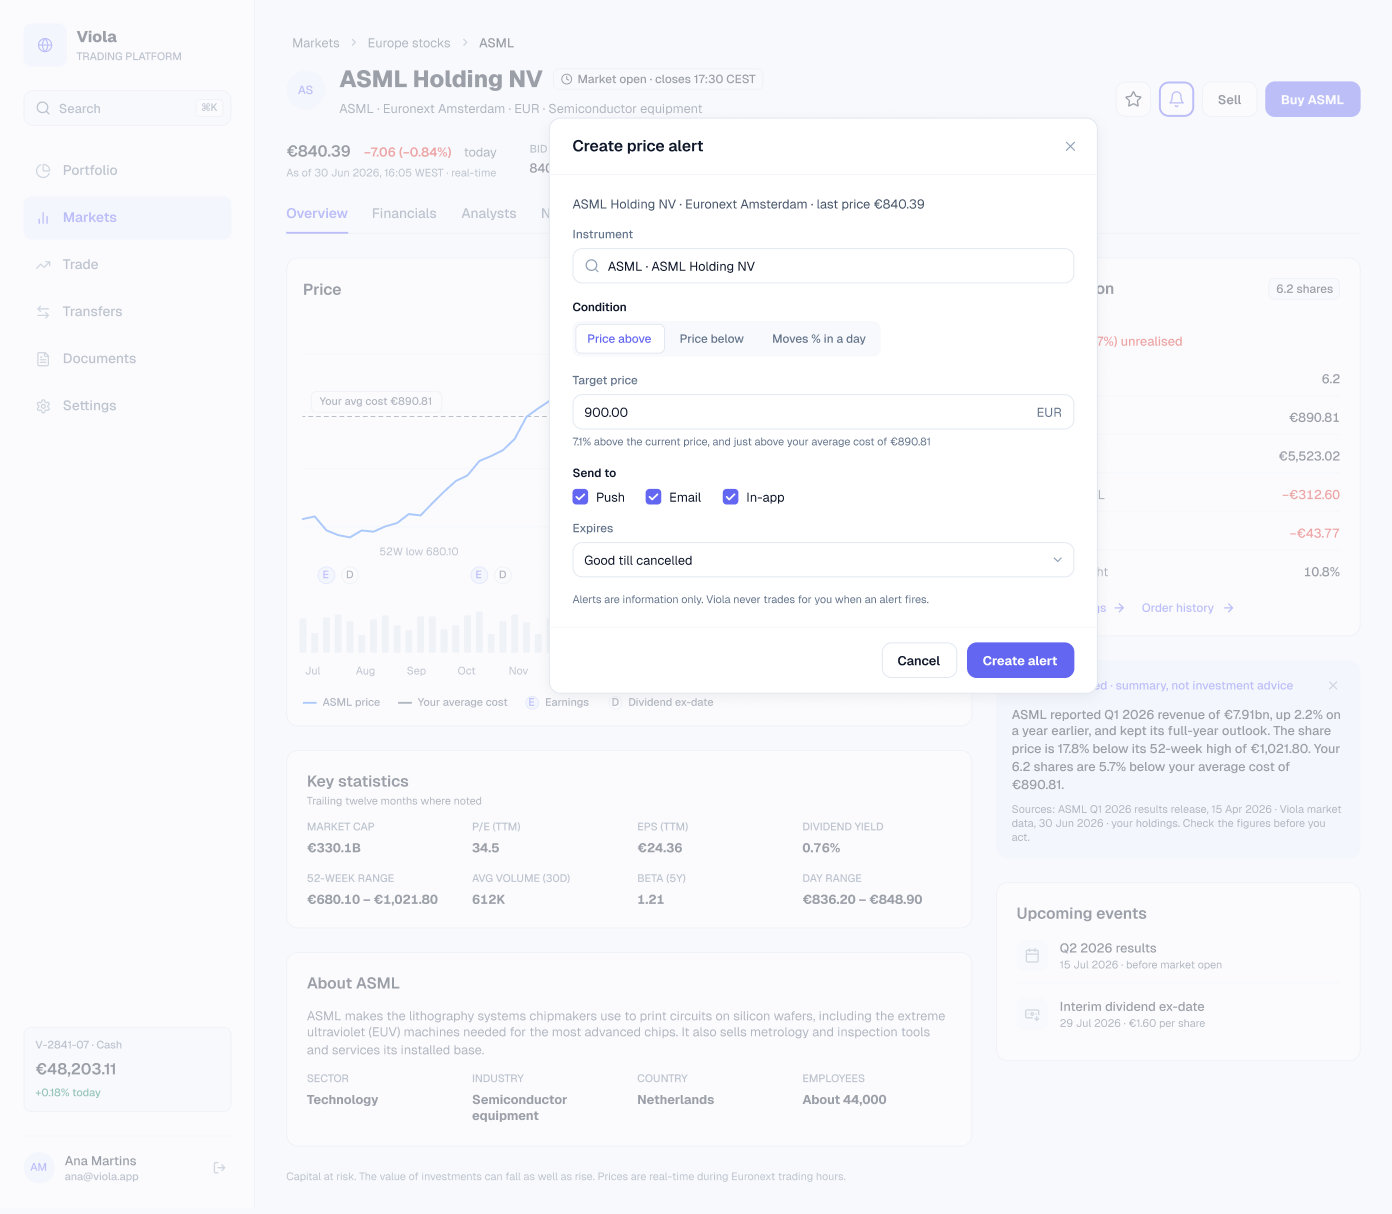
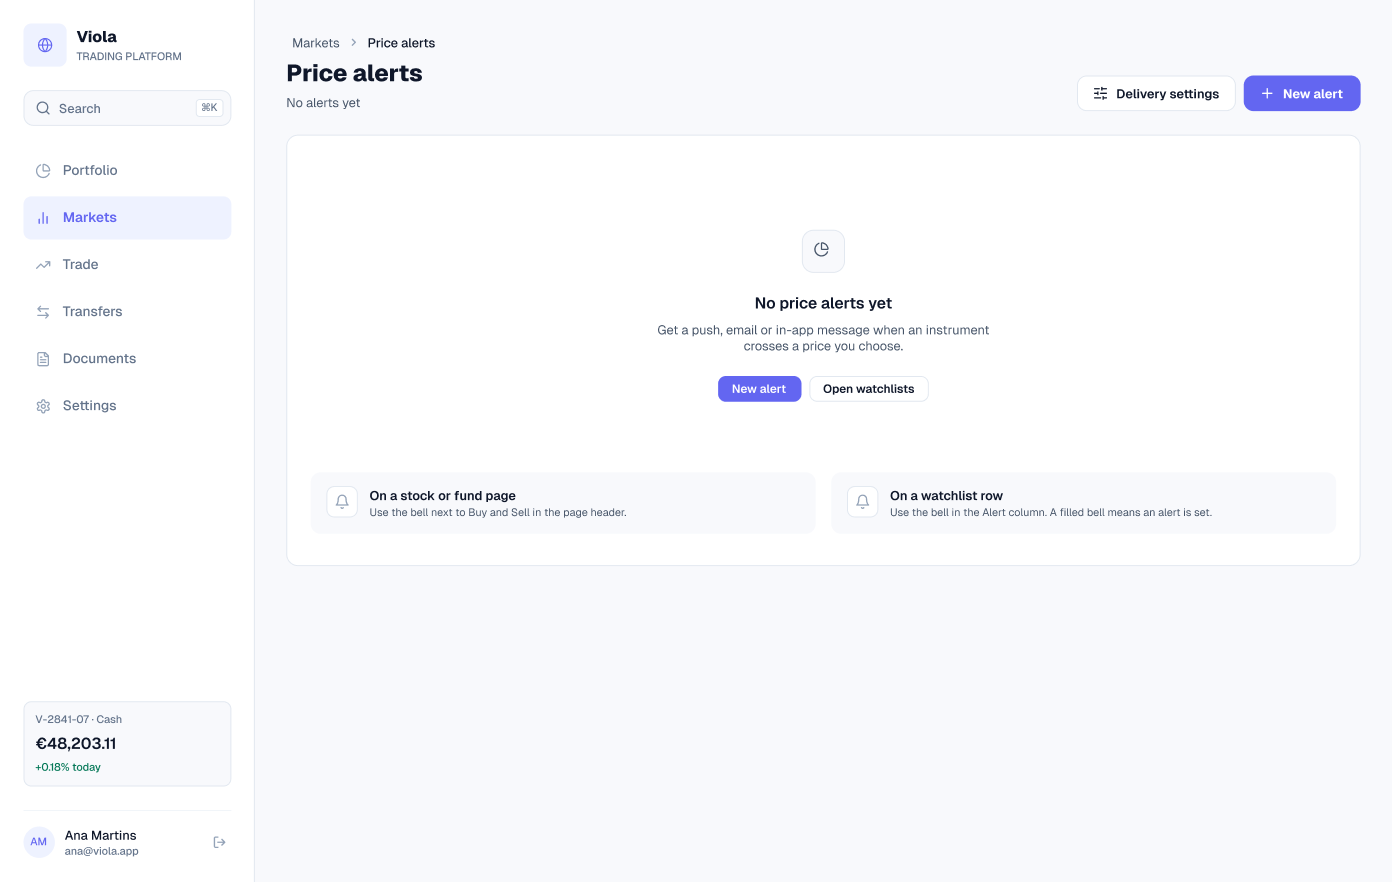
Every alert with its condition, target, current price and distance to target, plus recently triggered alerts. Alerts are created from the bell on any stock page or watchlist row, and are information only.
Screens at a glance
| Screen | What it shows | Built from |
|---|---|---|
| Markets | Indices, a filterable watchlist and an AI signal summary | sidebar, tab-item, sparkline, paginator, ai-market-brief, table/cell |
Data that agrees
The four instruments the customer holds lead the watchlist, at the same last price and daily change as the holdings table on the portfolio dashboard.
| Holding | Name | Last | Change |
|---|---|---|---|
| VWCE | FTSE All-World · Acc | 166.50 | +0.37% |
| CSPX | S&P 500 UCITS · Acc | 579.92 | −0.52% |
| ASML | ASML Holding | 840.39 | −0.84% |
| MSFT | Microsoft | 525.51 | +1.12% |
Built from
The screen is built from Viola components, so a change in the library reaches it. Counts are for the light screen.
| Component | Instances | Used on | What it does |
|---|---|---|---|
| table/cell | 88 | Markets | Watchlist rows |
| tab-item | 5 | Markets | Watchlist, US, Asia and Europe stocks, ETFs |
| sparkline | 4 | Markets | Index trends |
| sidebar | 1 | Markets | App navigation and the account card |
| range-tabs | 1 | Markets | Exchange and sector filters |
| paginator | 1 | Markets | Watchlist paging |
| ai-market-brief | 1 | Markets | AI News Trends |
Get the file
The Markets screens are in the full Viola UI kit, with 100+ screens in light and dark. Open the Figma preview to see them all, or get the kit for $49.